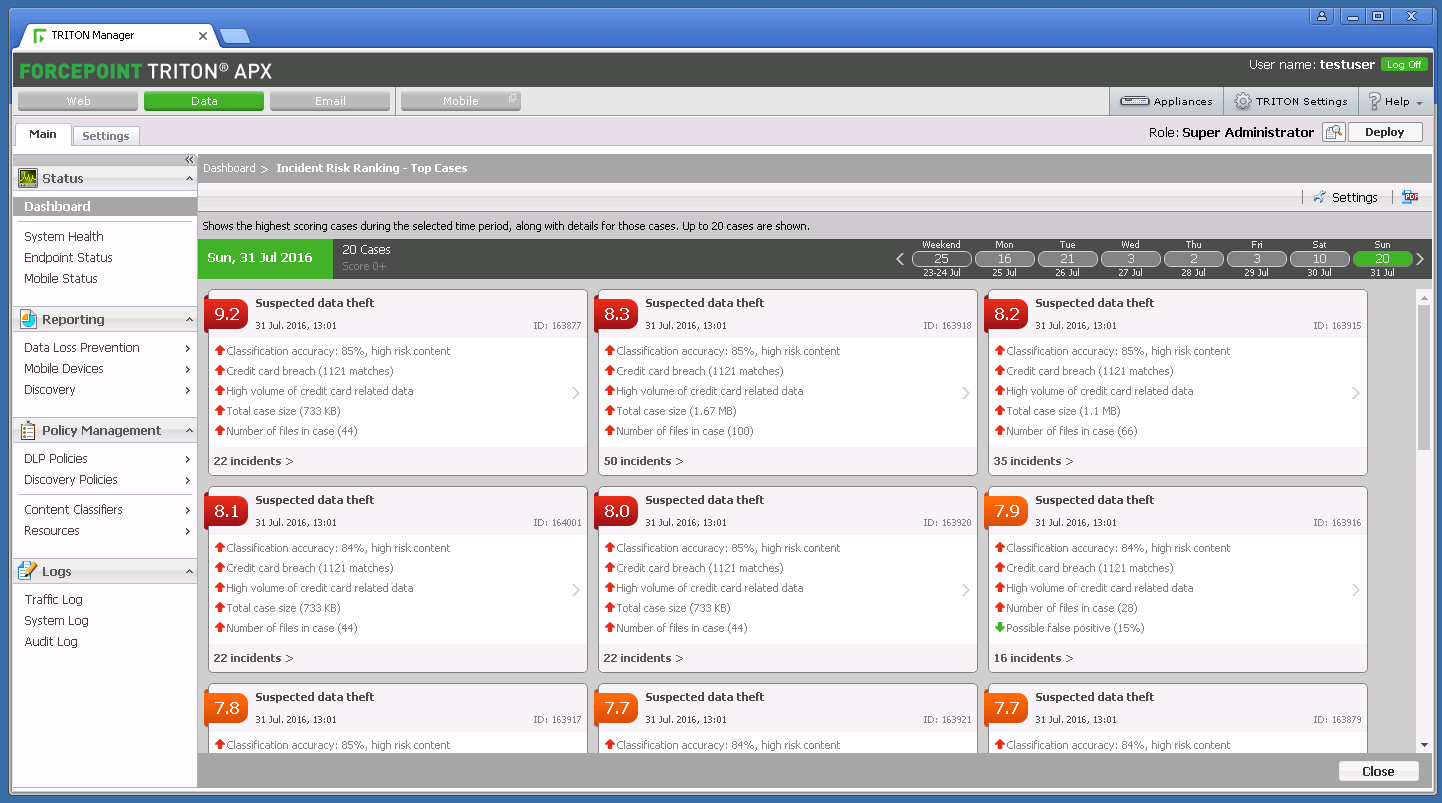
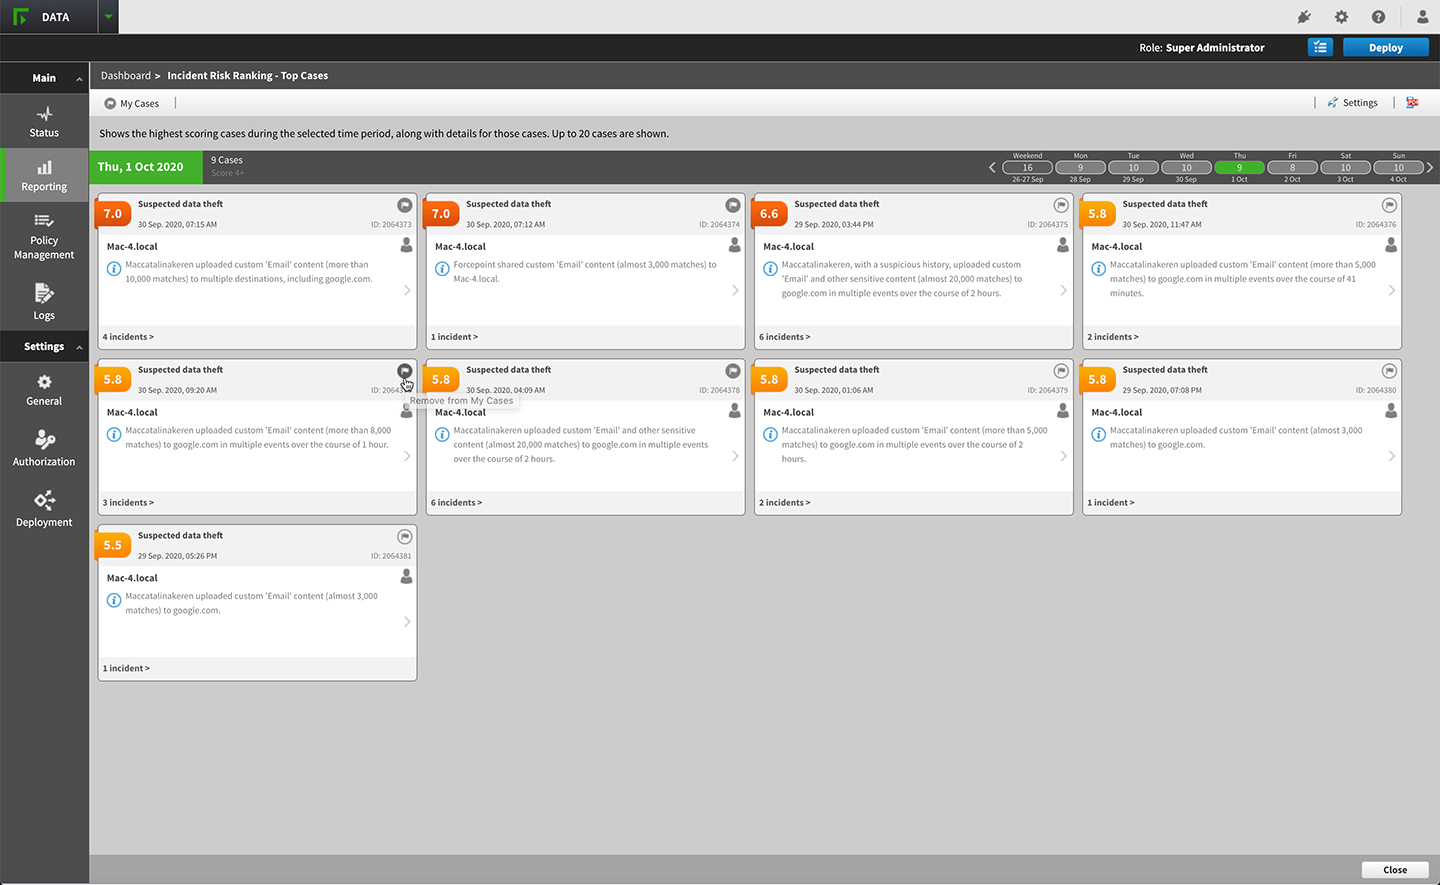
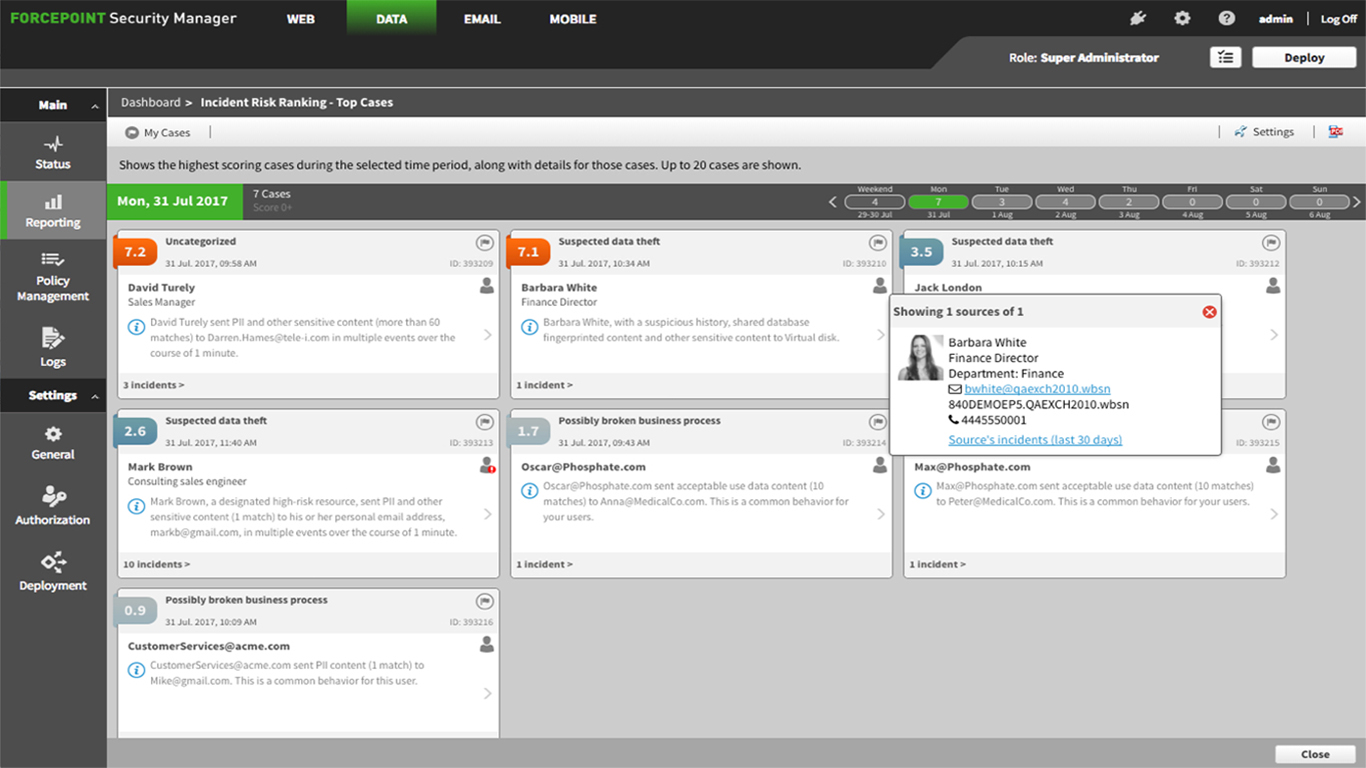
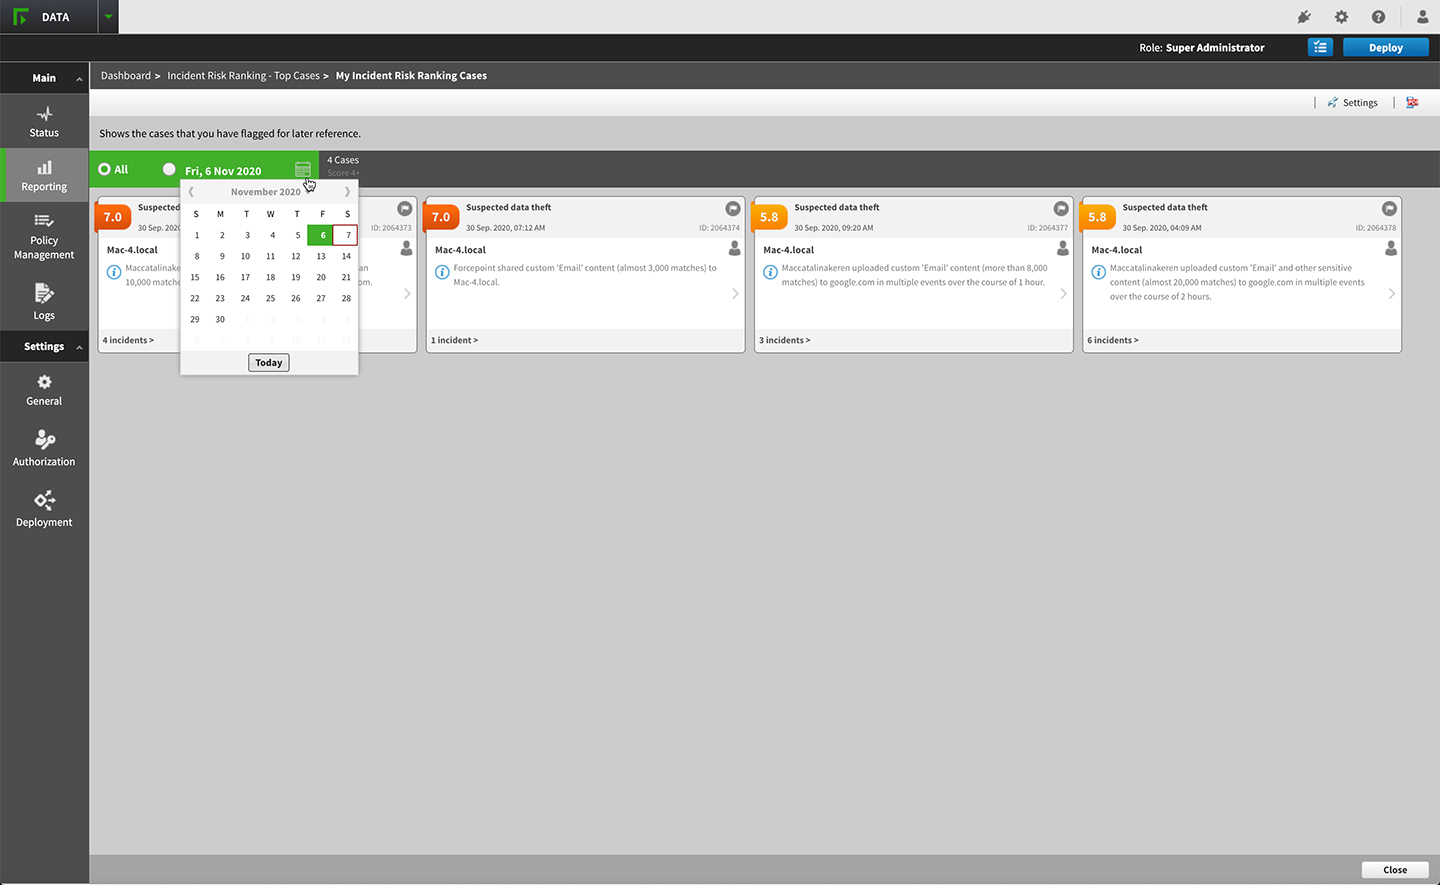
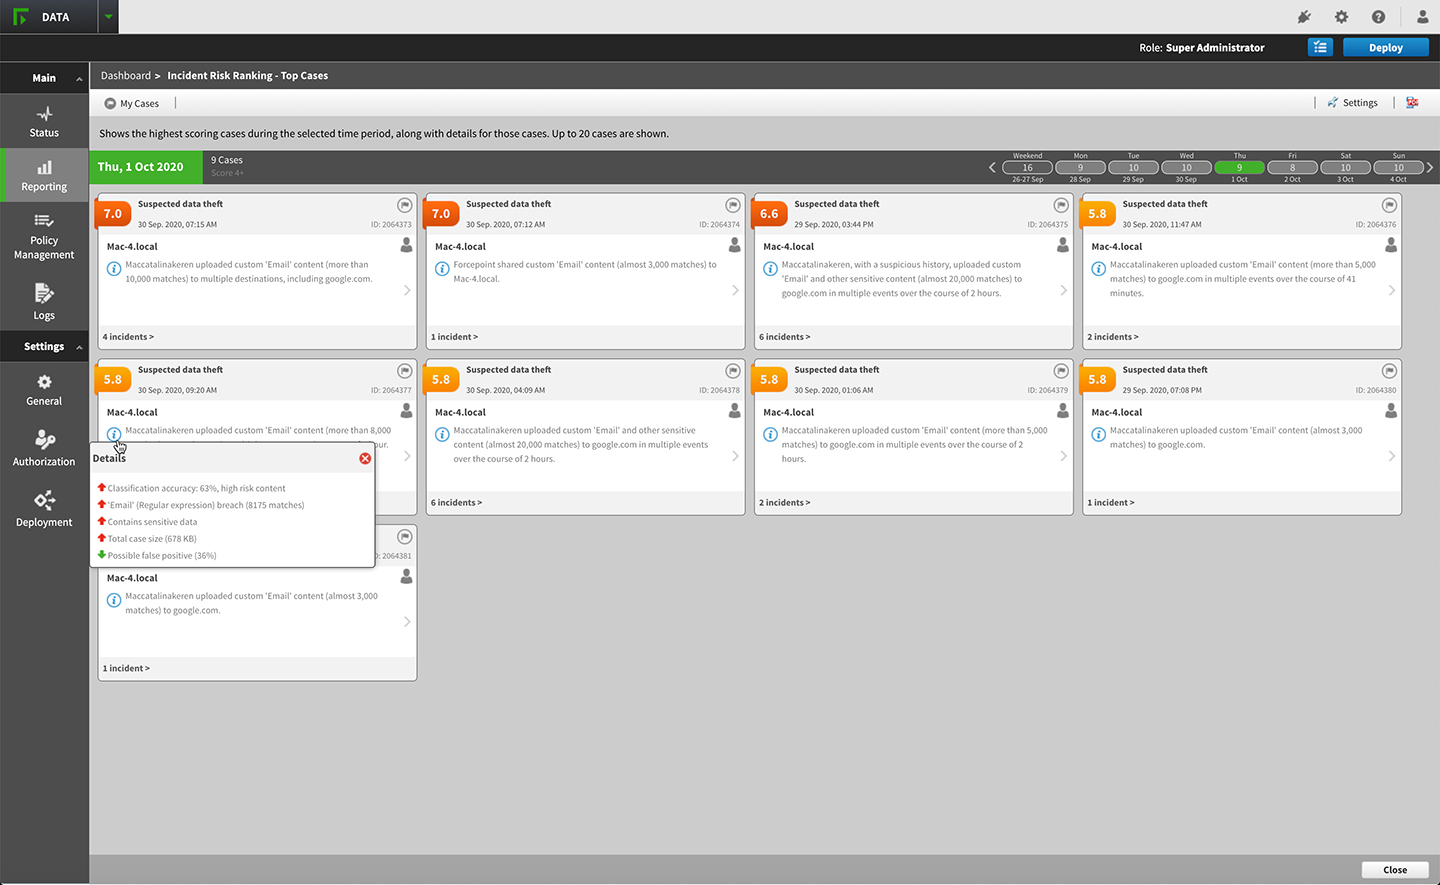
A view that offers administrators a comprehensive interface to monitor, assess, and respond to DLP (Data Leak Prevention) security incidents and associated risks.
Cases are groups of related incidents that combined, indicate a risk to the organization—for example, incidents of data being sent to suspicious destinations or incidents occurring outside regular office hours. Cases are assigned risk scores by a sophisticated, Linux-based analytics engine.
Challenges & Solutions
- Volume of Incidents:
Problem:
Too many incidents per day can overwhelm the administrator, making it difficult to identify significant threats.
Solution: Used a sophisticated algorithm to prioritize and rank incidents by risk, ensuring the most critical issues are highlighted. - Pattern Recognition:
Problem:
Administrators might miss patterns related to specific users that indicate a higher risk to the organization.
Solution:
Grouped incidents related to the same user or behavior pattern into cases, making it easier to identify recurring issues. - Focus on High-Risk Incidents:
Problem:
With numerous incidents displayed, it’s challenging to focus on the riskiest ones.
Solution:
Implemented risk scoring to rank cases, allowing admins to quickly see and act on the highest-risk incidents.
Process
- Research and Requirement Definition:
Met with customers to understand their needs.
Collaborated with research, product, and development teams to finalize the requirements and potential solutions. - Solution Implementation:
Algorithm Use:
A Linux-based analytics engine assigns risk scores to incidents.
User Language Translation:
Converted complex algorithms into a simple, user-friendly interface.
Case Creation:
Grouped related incidents into cases to reduce the number of items administrators need to review.
Incident Ranking:
Ranked incidents within cases based on various factors like the number of matches, transaction size, content, breached policies, and more.
UX Design Details
- Dashboard Overview:
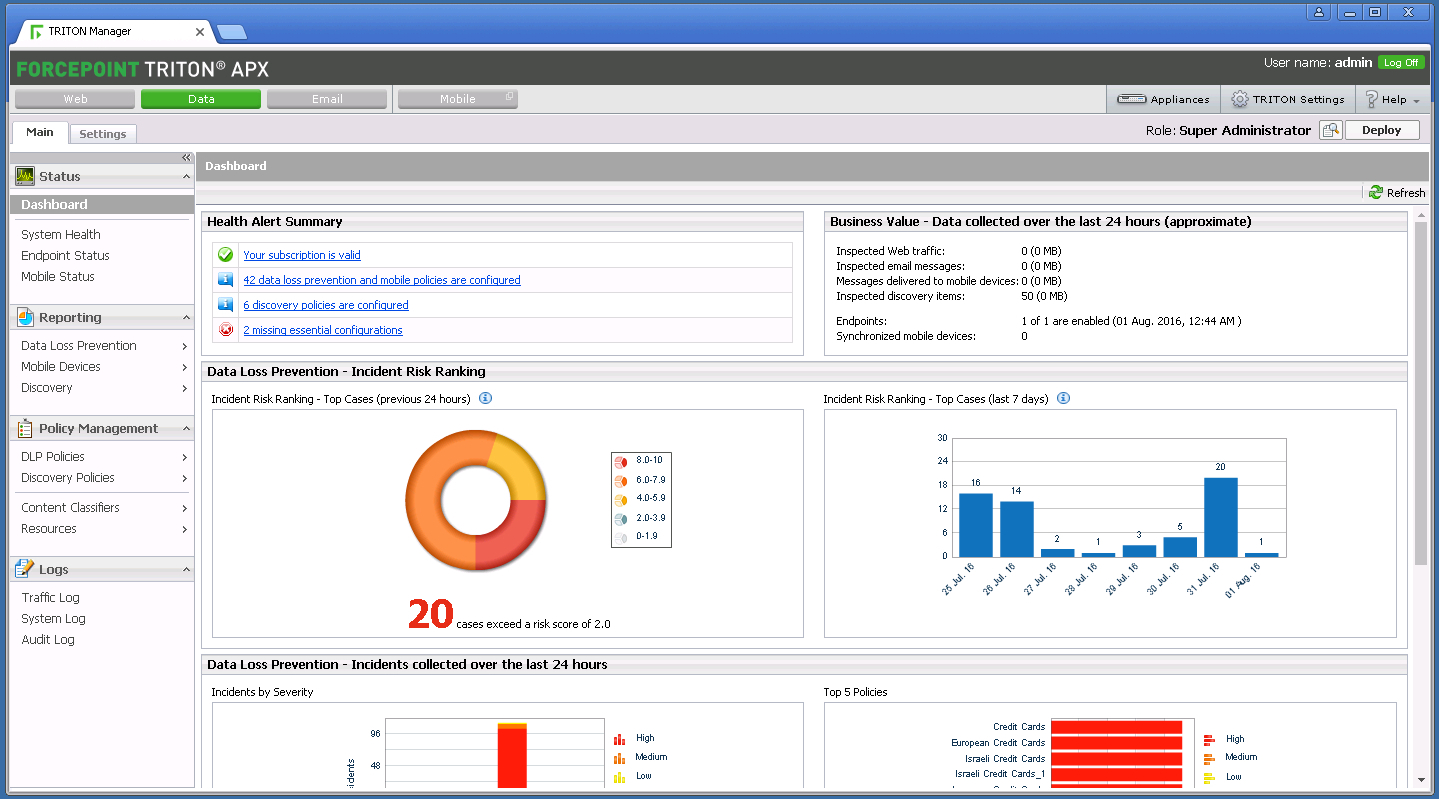
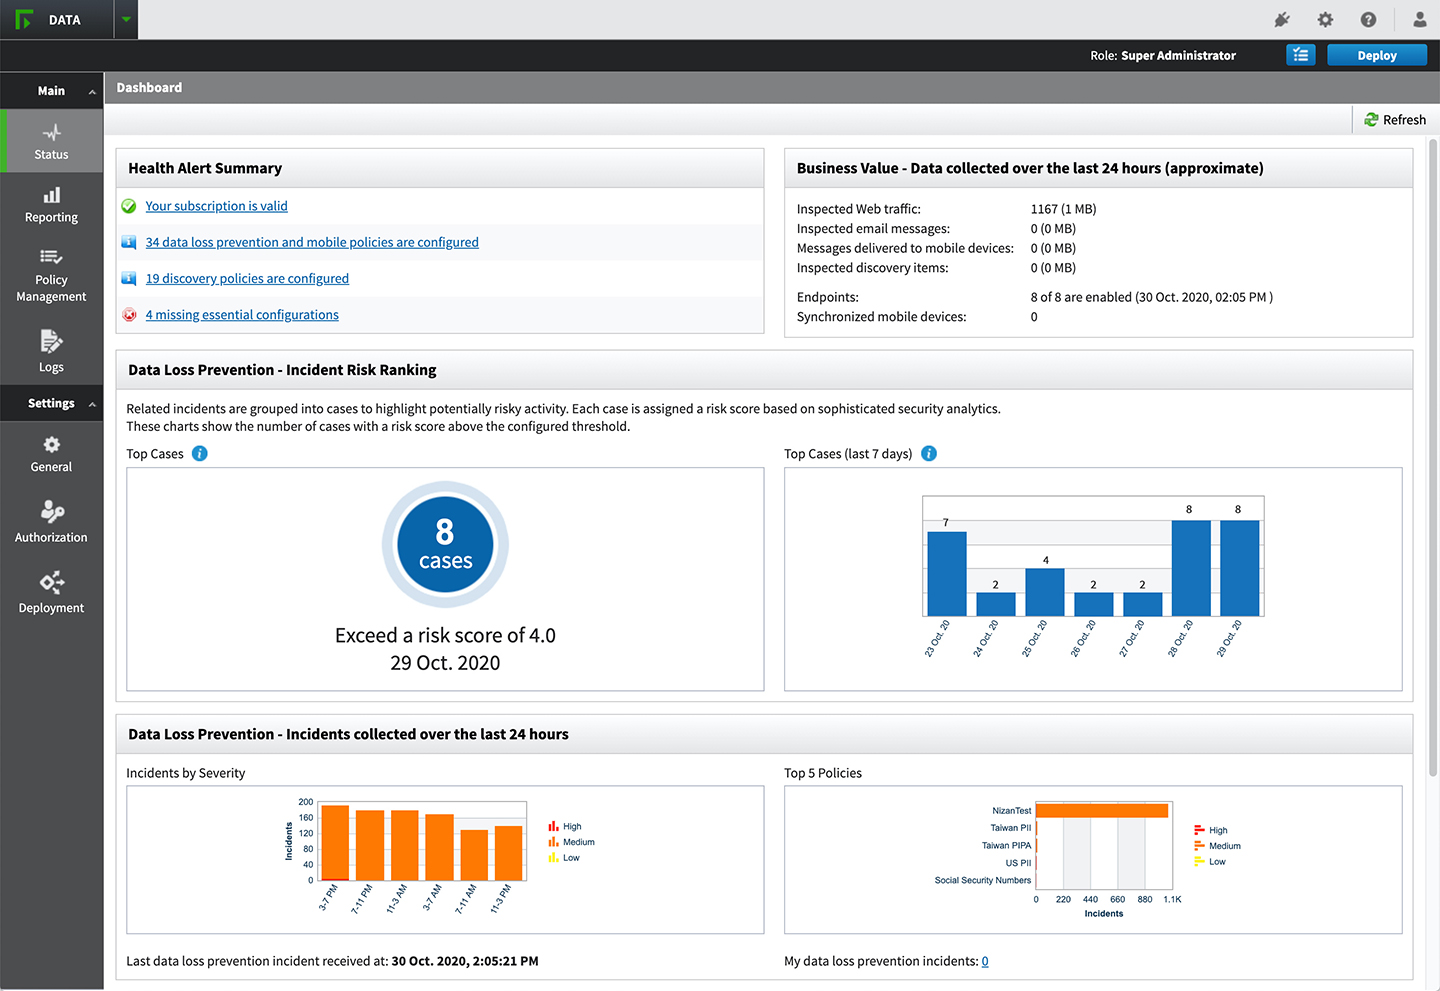
Data Loss Prevention (DLP) Dashboard:
Displays health alerts, business value data, and top cases with their risk scores.
Incident Summary:
Provides a summary of incidents collected over the last 24 hours, categorized by severity and policies. - Incident Risk Ranking (IRR):
Top Cases Display:
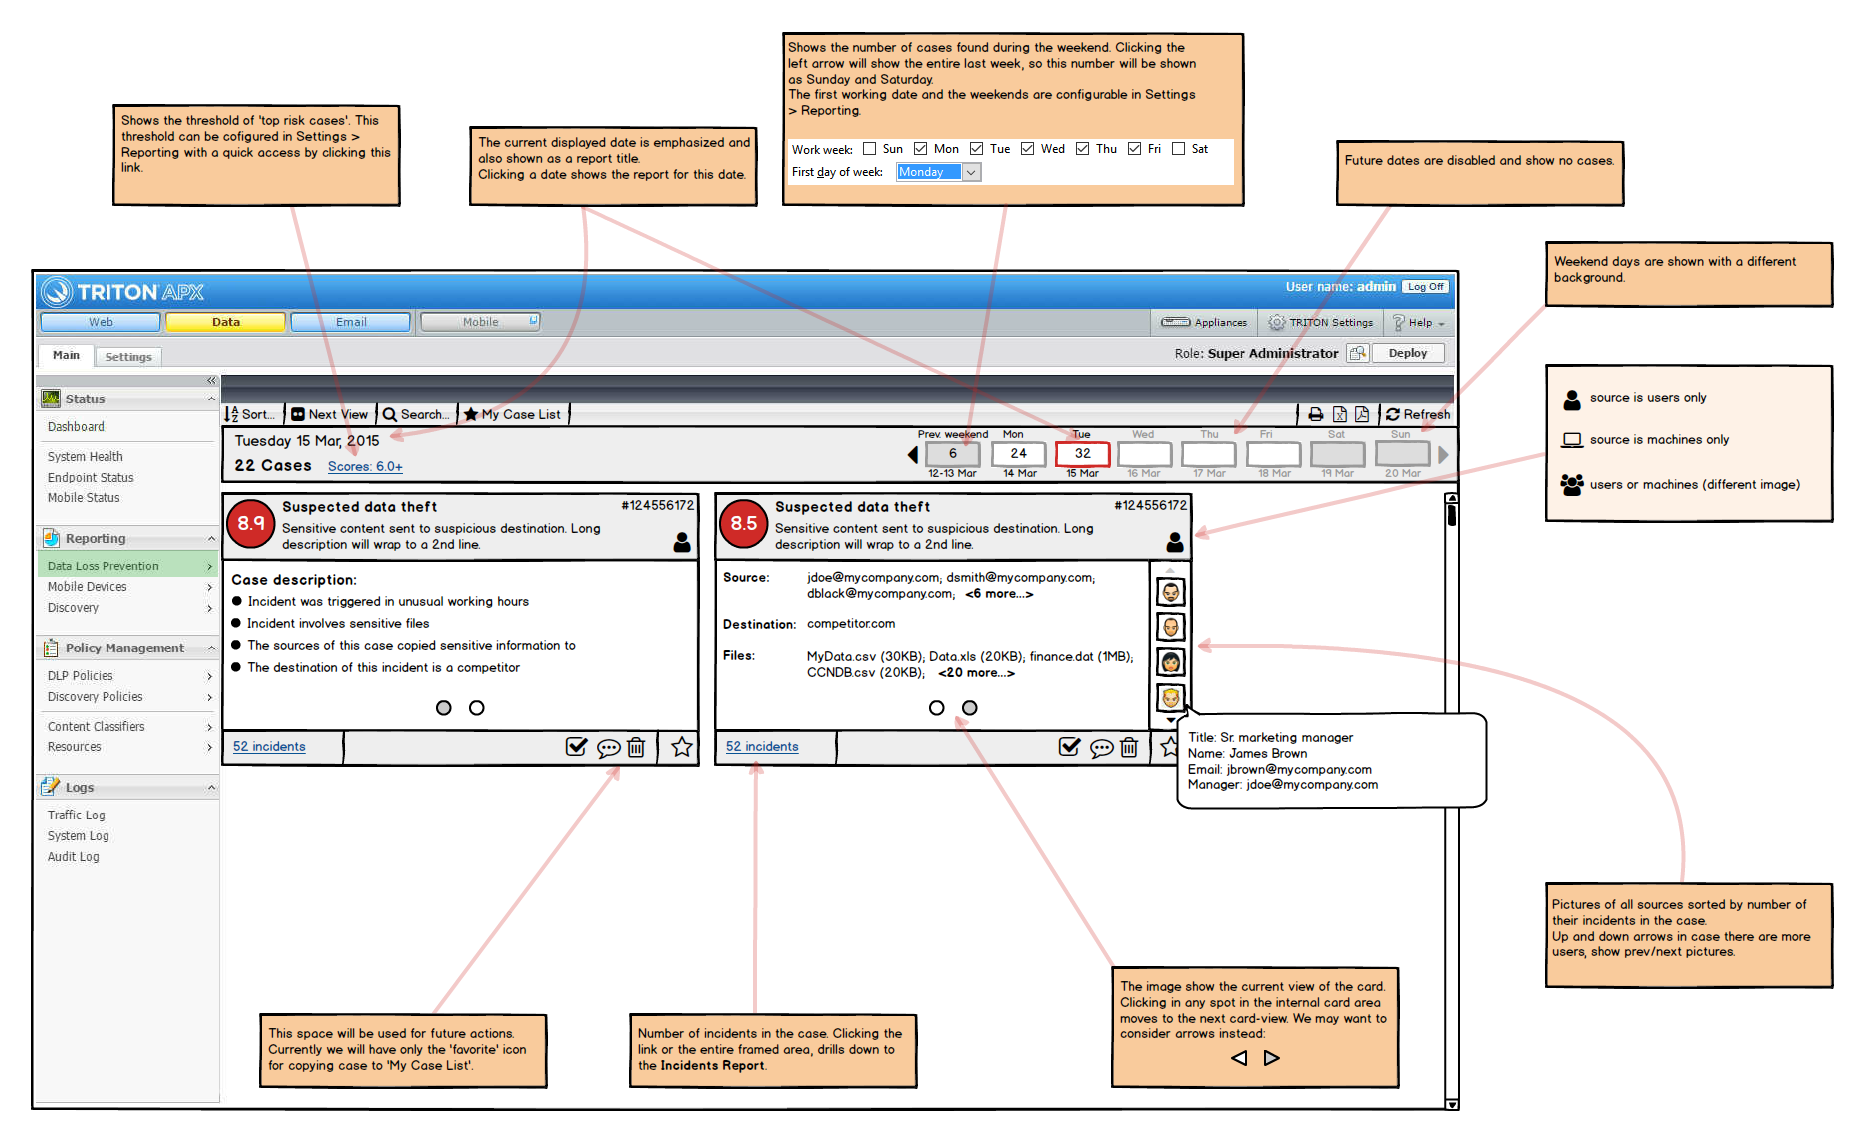
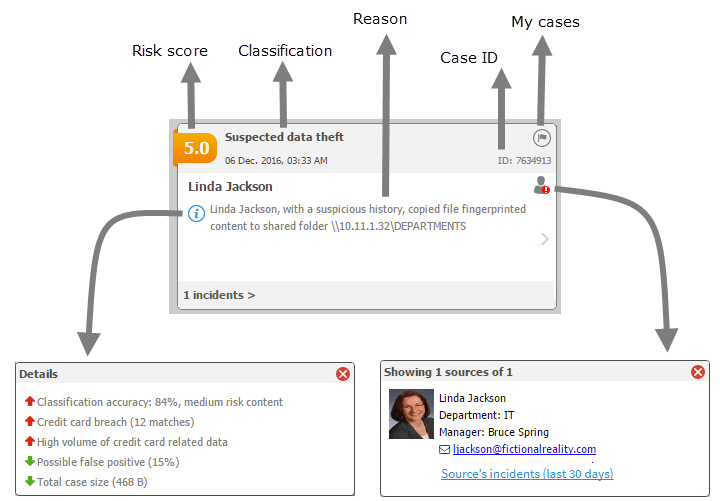
Shows the highest scoring cases with detailed information about each incident, such as the user involved, date, and risk score.
Filtering and Sorting:
Allows administrators to filter and sort cases by various criteria, such as date and risk score. - Detailed Incident View:
Incident Details:
Provides in-depth information on each incident within a case, including the type of data involved and the context of the breach.
Classification Accuracy:
Displays metrics such as classification accuracy, the number of matches, and possible false positive rates to help admins assess the incident’s severity. - Settings and Customization:
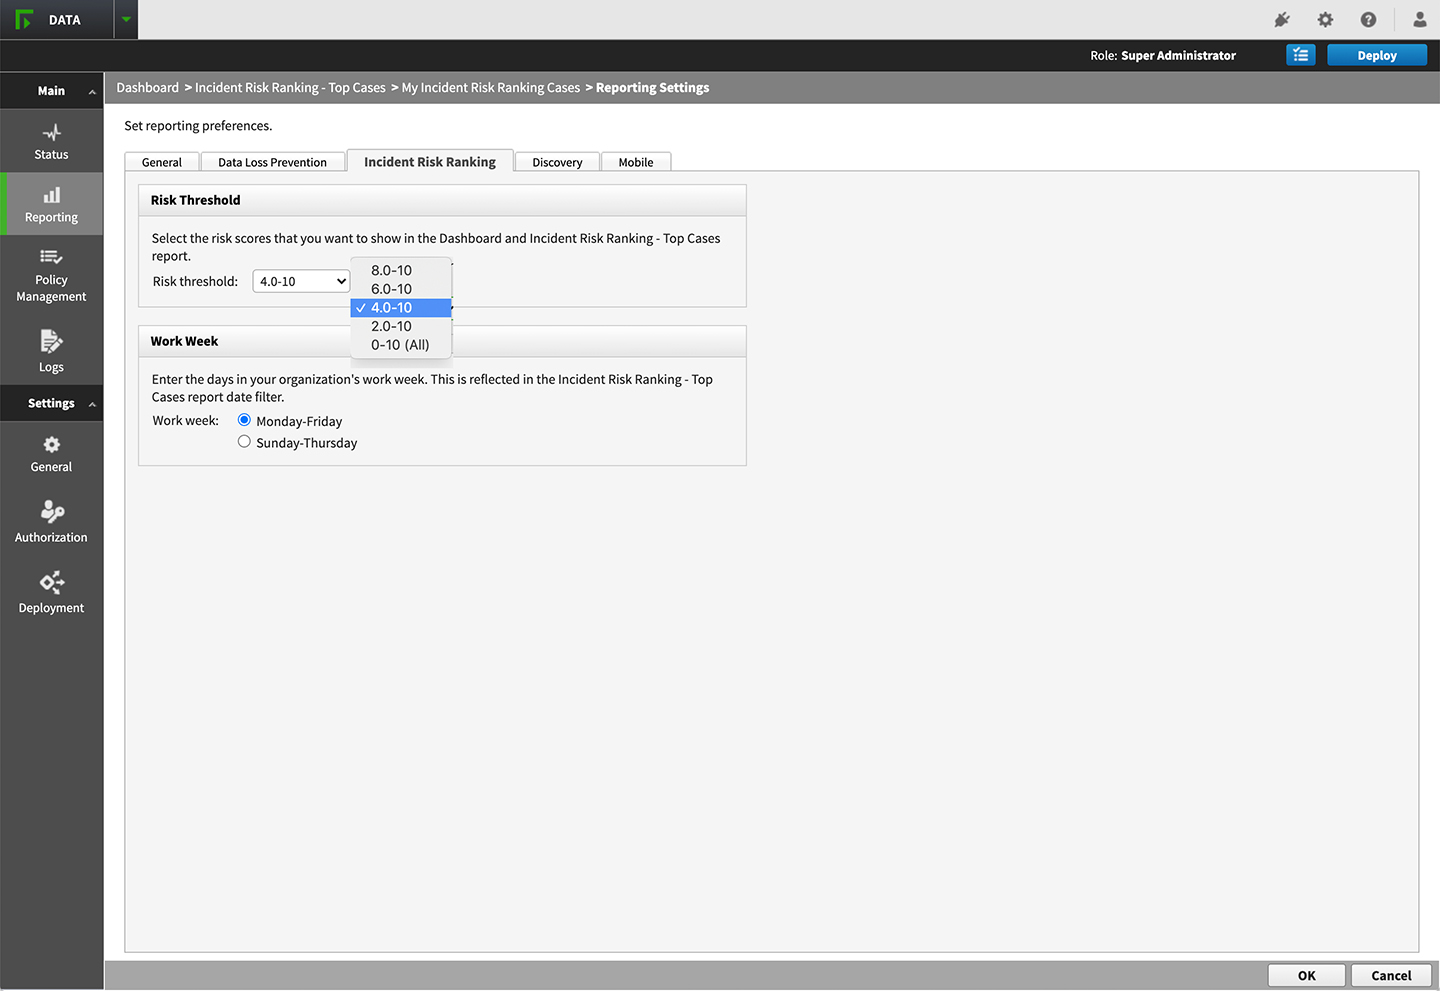
Risk Threshold Settings:
Allows administrators to set the risk score threshold for incidents displayed on the dashboard.
Work Week Configuration:
Enables customization of the organization’s work week, affecting how incidents are reported and ranked.
By addressing these challenges with carefully thought-out solutions, the UX design ensures that administrators can effectively manage and mitigate risks associated with data loss incidents. The design emphasizes clarity, prioritization, and ease of use, making it a robust tool for cybersecurity management.
Click the gallery to see more screenshots.

