Designing an endpoint status screen for a DLP (Data Leak Prevention) cybersecurity company involves several UX challenges and requires thoughtful solutions to ensure the interface is intuitive, informative, and efficient for administrators.
Challenges & Solutions
- Complex Information Hierarchy:
Challenge:
Presenting a vast amount of information about multiple endpoints in a clear and manageable way without overwhelming the user.
Solution:
Utilized a dashboard that provides a high-level overview with the ability to drill down into detailed information. Used progressive disclosure to show detailed data only when necessary.
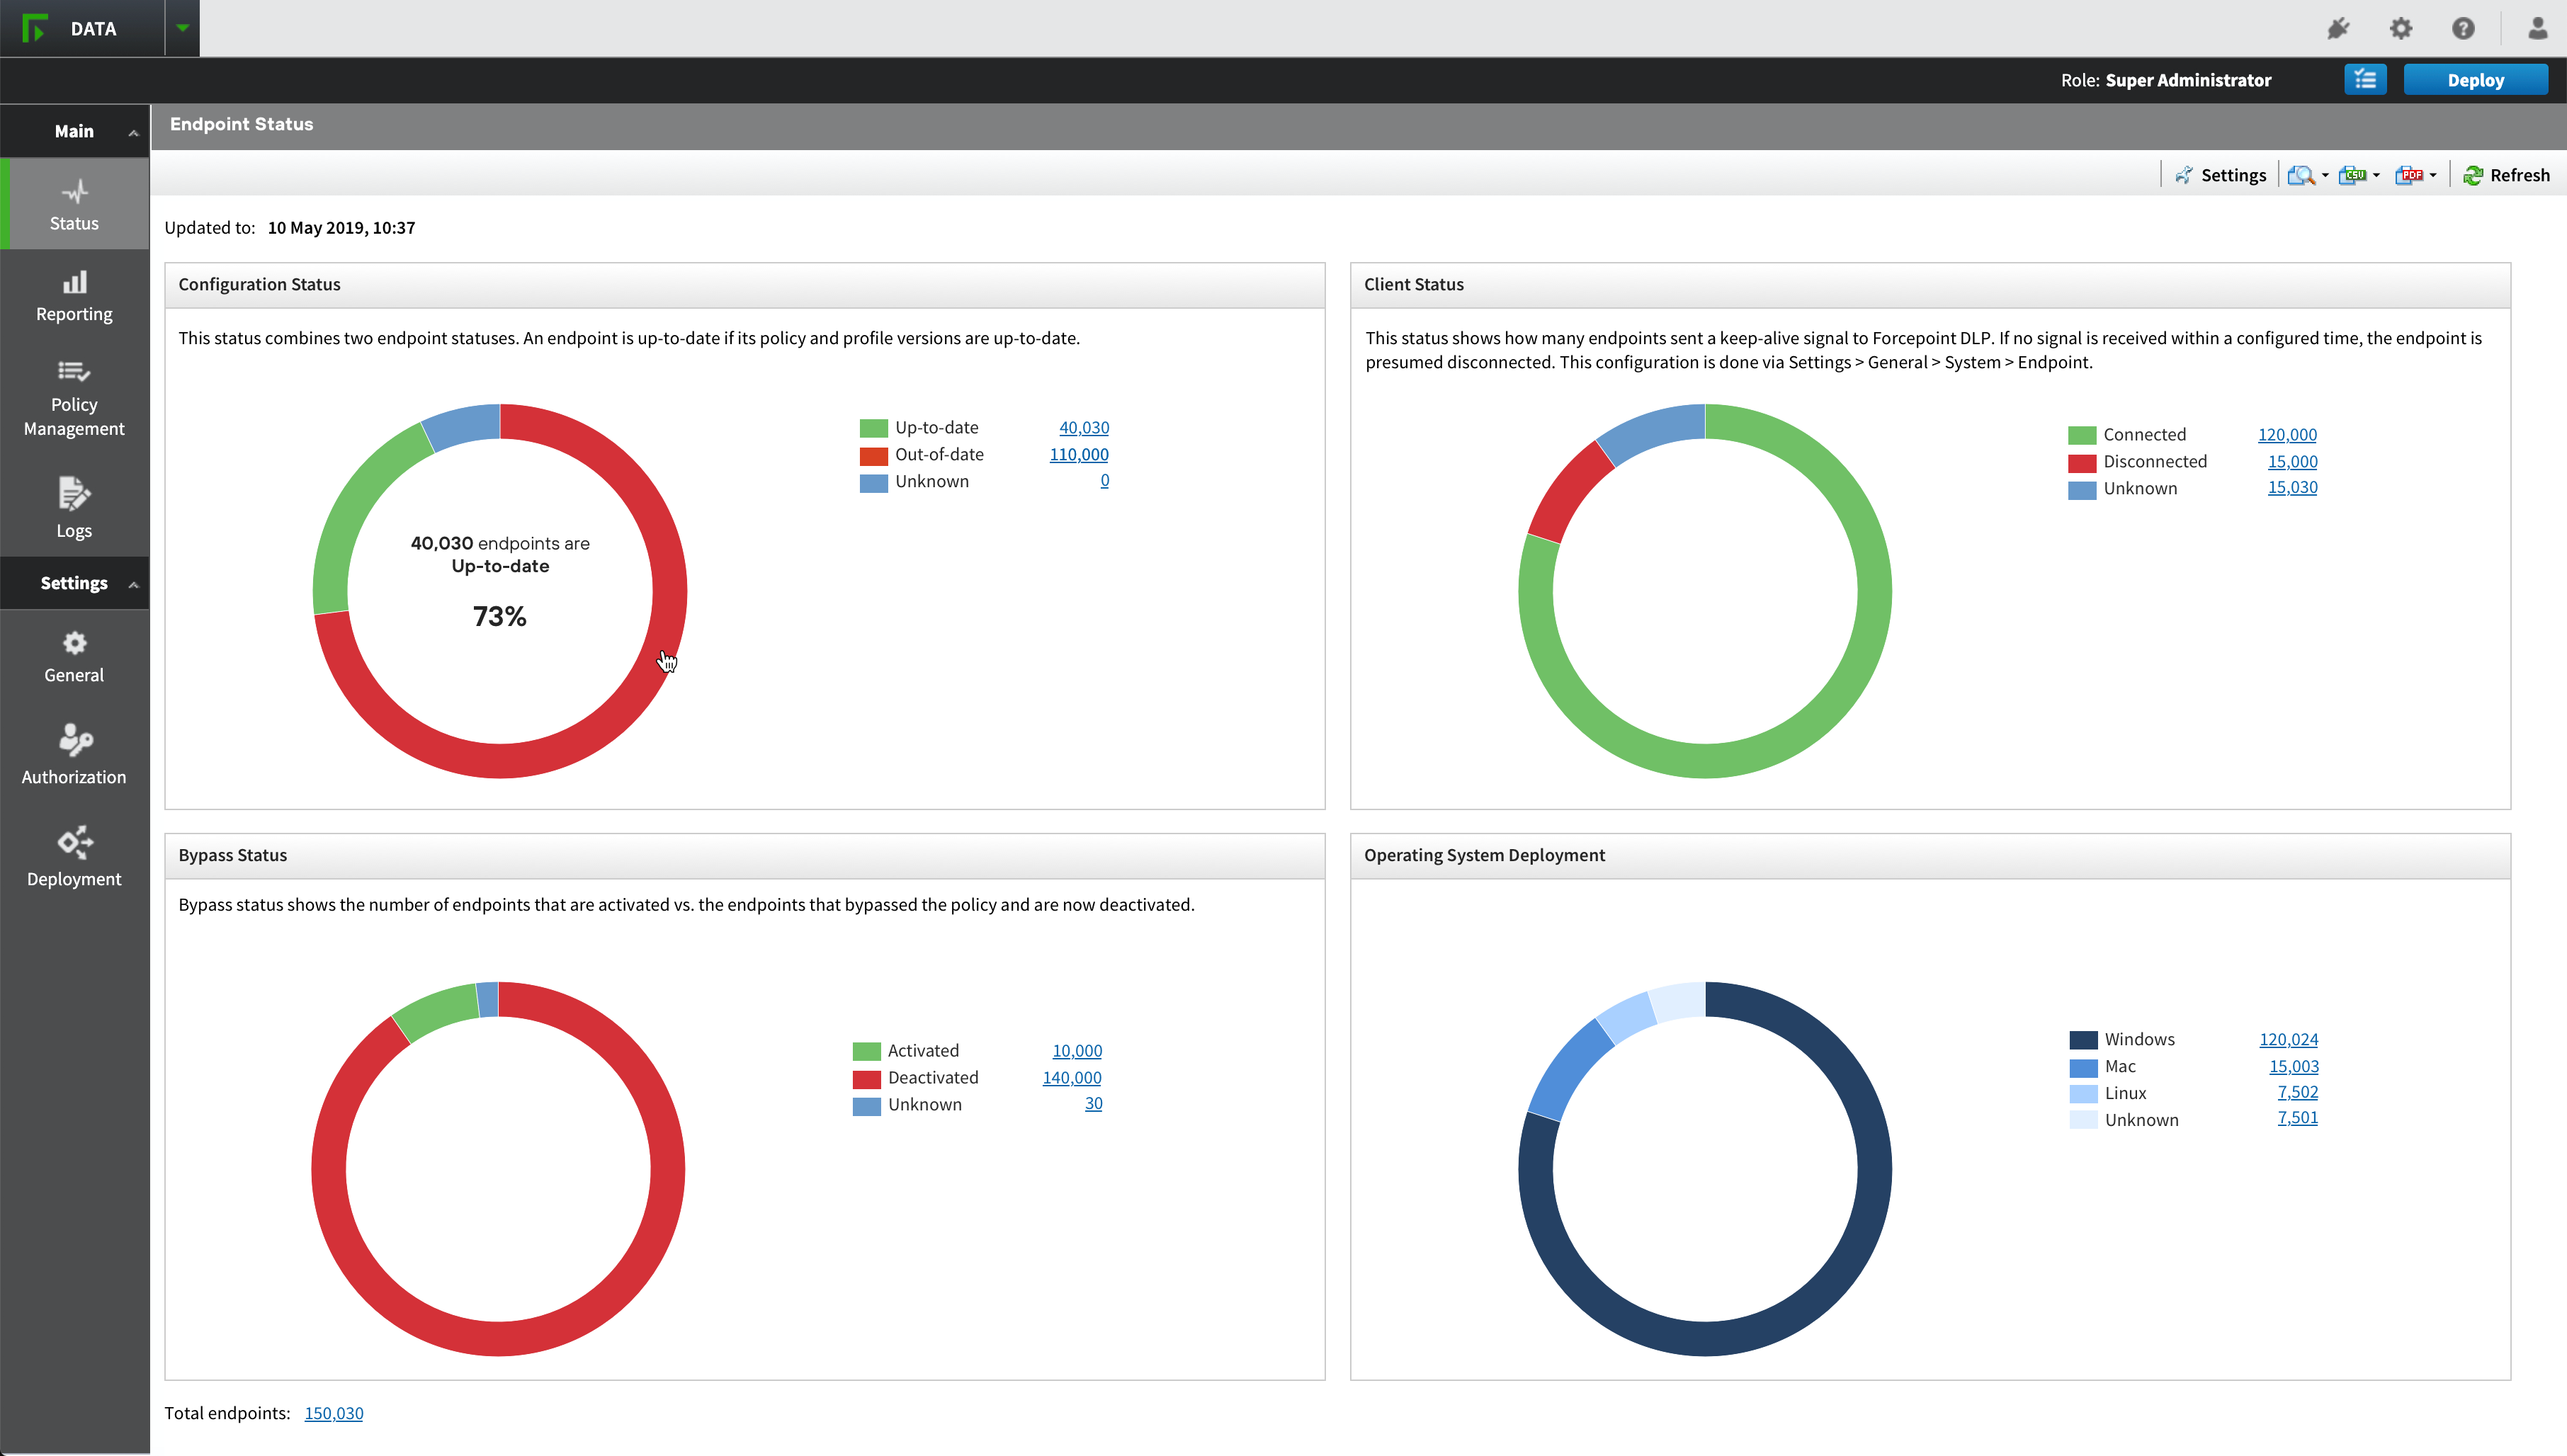
The main dashboard provides a high-level overview of various statuses, such as configuration, client status, bypass status, and operating system deployment. This helps in giving a quick summary of the overall health and status of the endpoints. This design follows the principle of progressive disclosure by presenting summary information first and allowing the user to drill down into detailed data as needed. This approach prevents information overload and makes the system easier to navigate. - Navigation and Usability:
Challenge: Ensuring that users can easily navigate between the global dashboard and the detailed endpoint views.
Solution: Implemented a clear and consistent navigation structure. Used breadcrumbs to help users understand their location within the interface and move seamlessly between different levels of information. The left-side navigation menu categorizes key areas such as Status, Reporting, Policy Management, Logs, and Settings. Each category provides access to more specific screens, ensuring users can easily find the information they need. - Filtering and Searching:
Challenge: Allowing users to quickly find specific endpoints or information amidst potentially large datasets.
Solution: Integrated powerful filtering and search tools that enable users to refine the data displayed based on various criteria. Offered options to save common filters for repeated use.
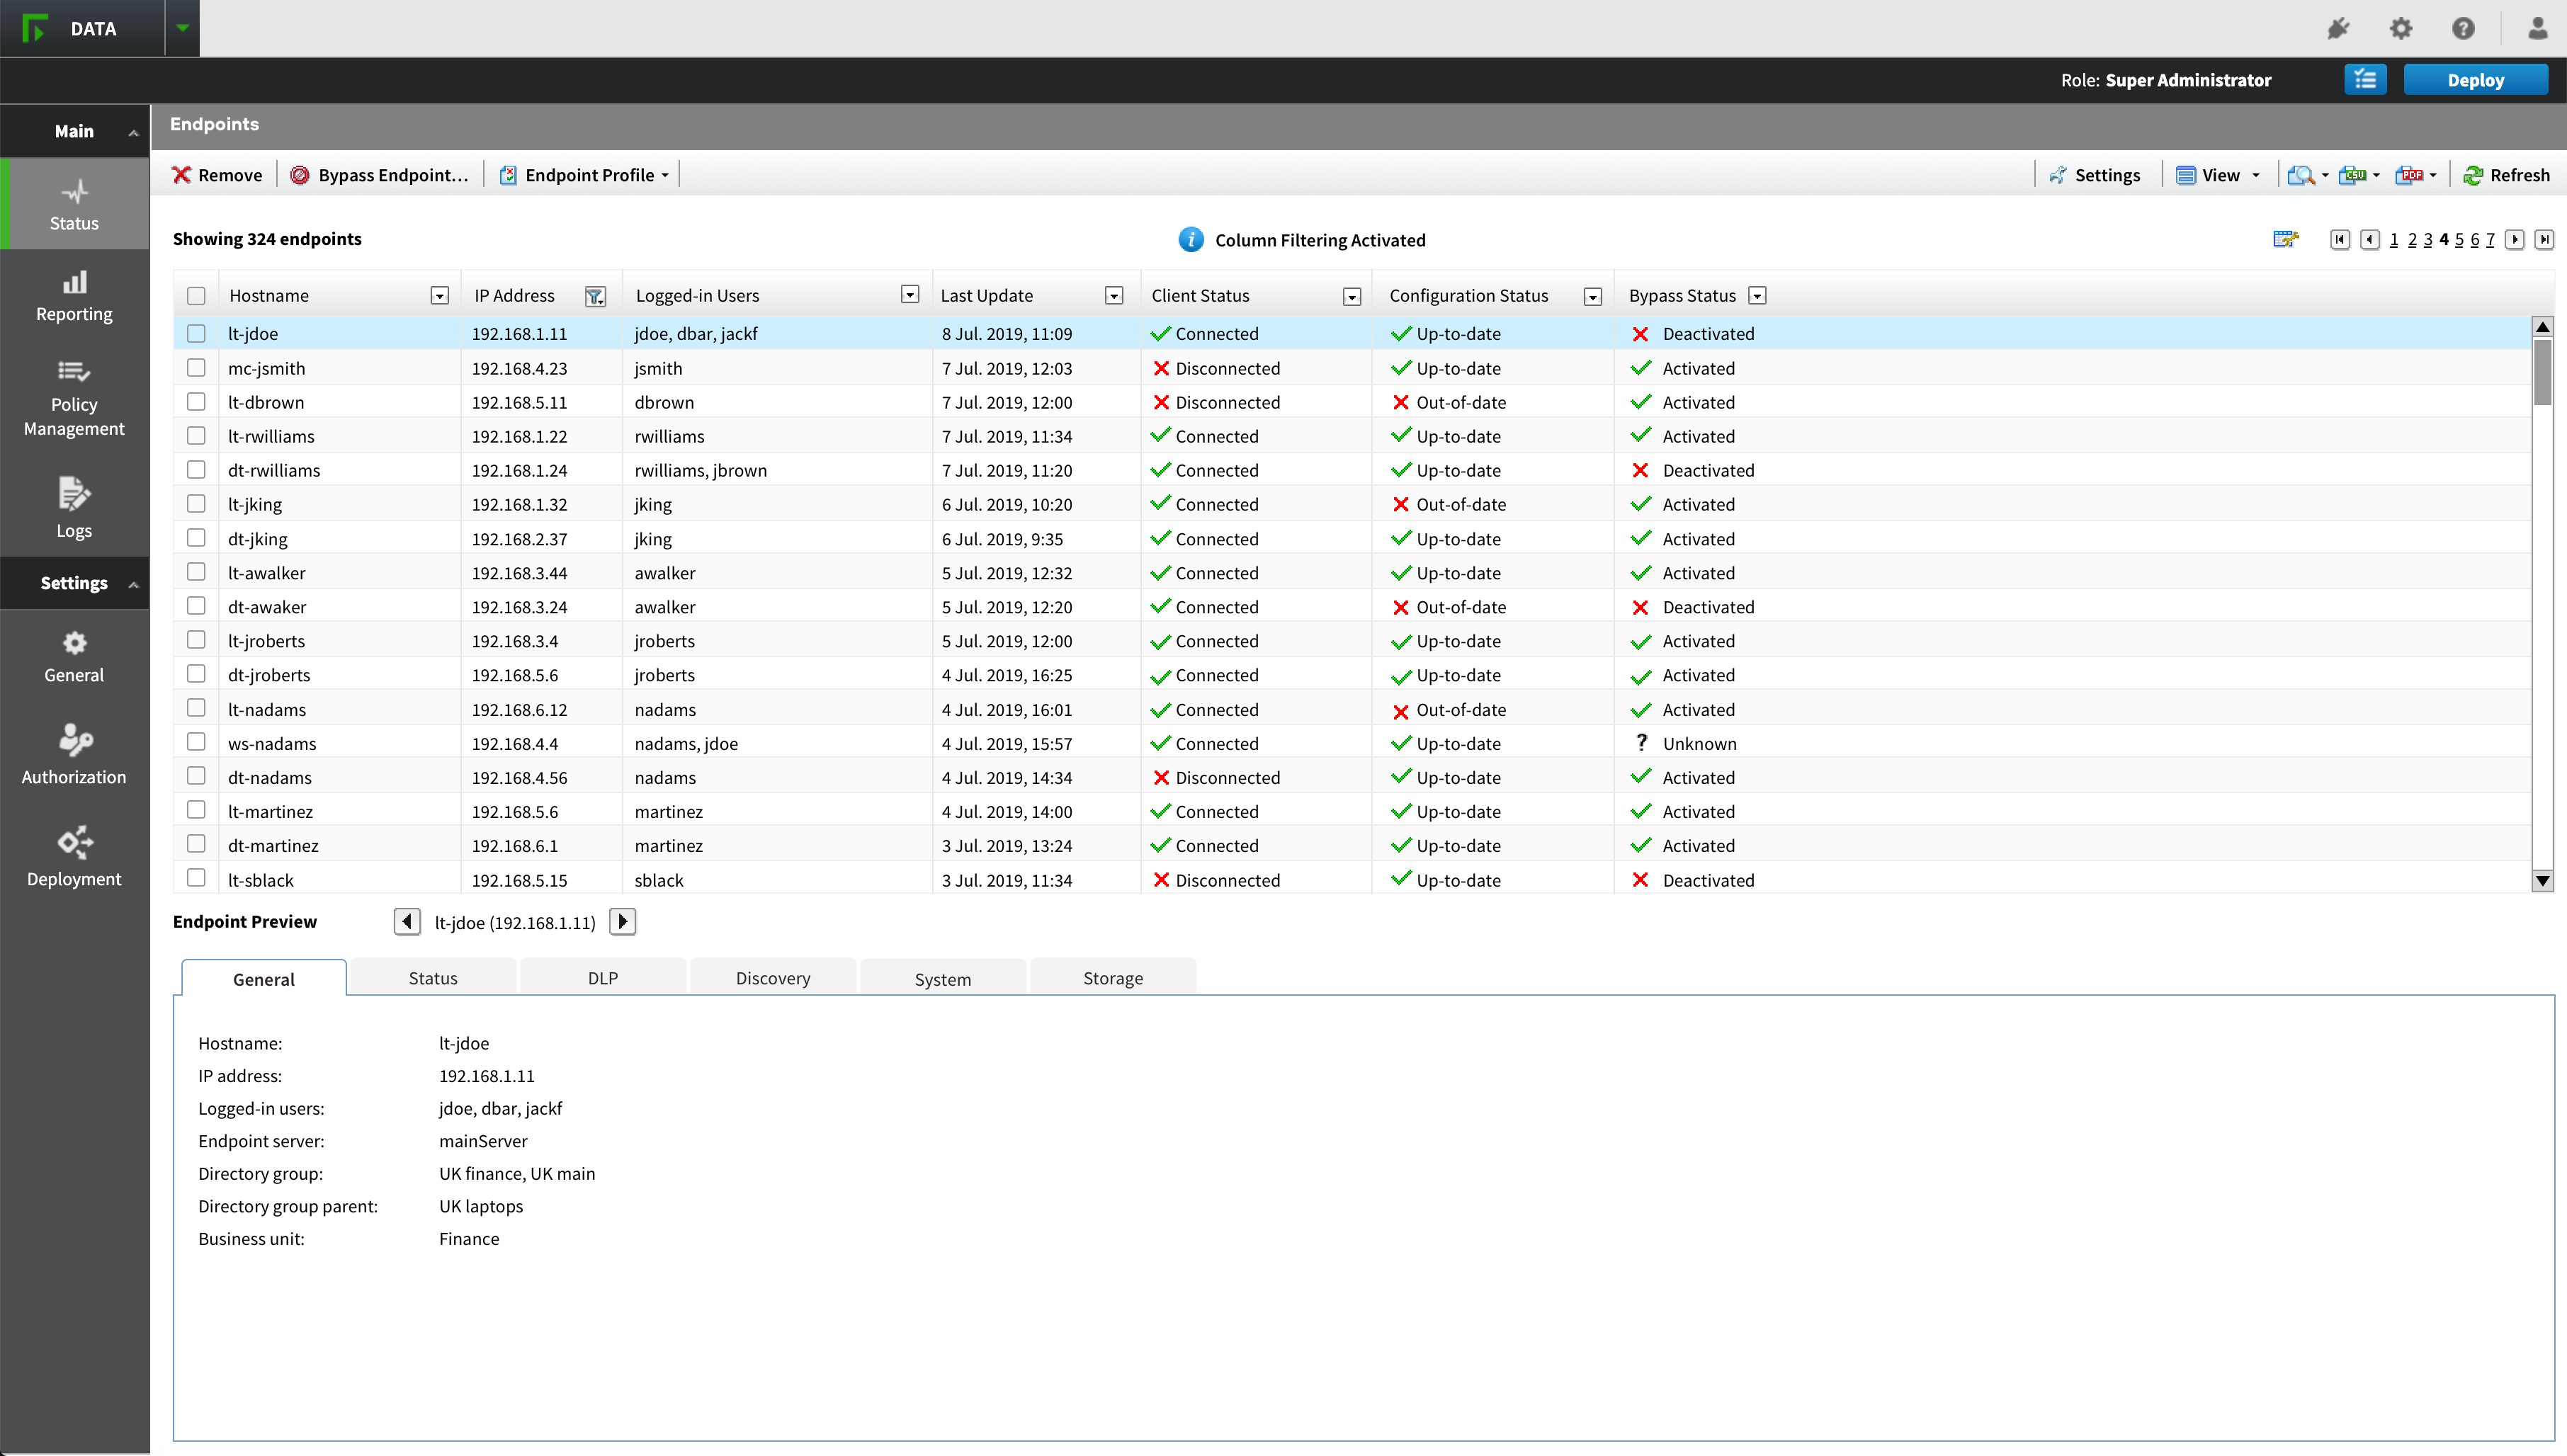
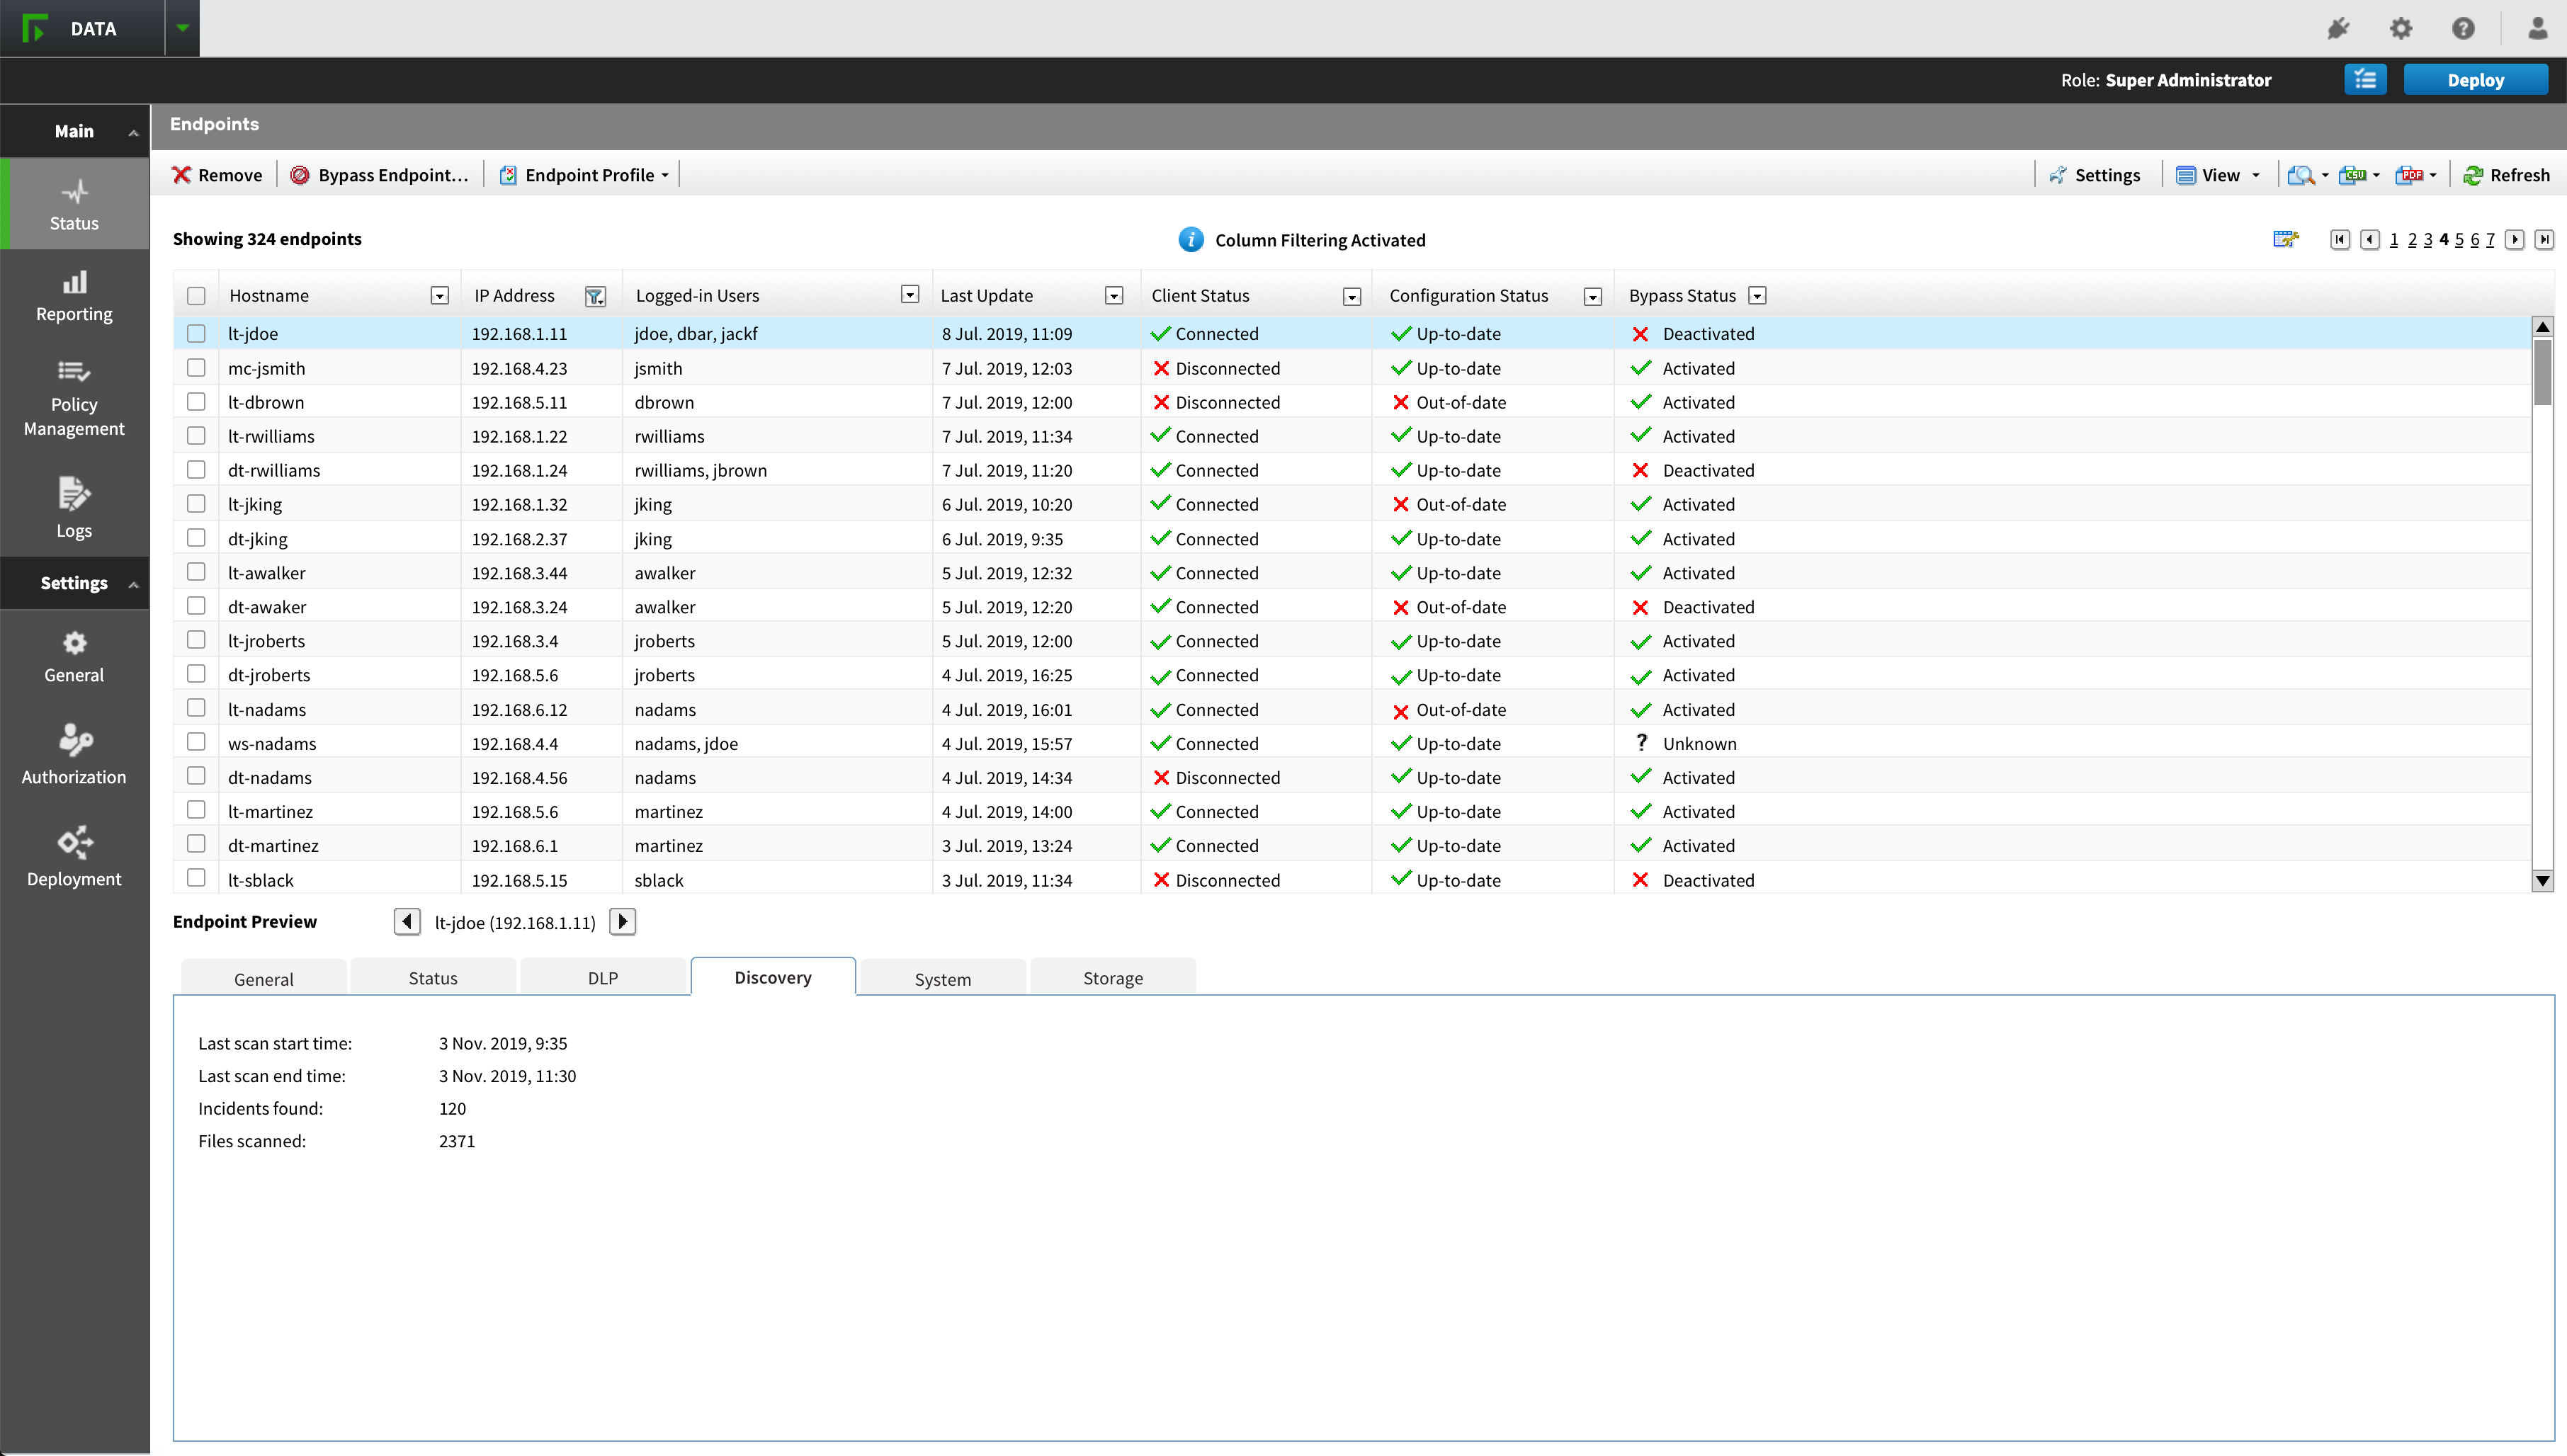
The endpoint list includes column headers that can be used for filtering and sorting. Additionally, there are batch action buttons at the top, such as “Remove” and “Bypass Endpoint,” which allow for easy management of multiple endpoints.Providing filtering and sorting directly within the table headers makes it intuitive for users to refine their view based on specific criteria. This design choice enhances efficiency and usability, allowing administrators to quickly locate and manage endpoints. - Data Presentation:
Challenge: Displaying detailed endpoint information in a way that is easy to read and interpret.
Solution: Used tables with sortable columns and customizable views. Allowed users to select which columns are displayed and how data is grouped. Incorporated visual aids like icons, color coding, and charts to enhance data comprehension.
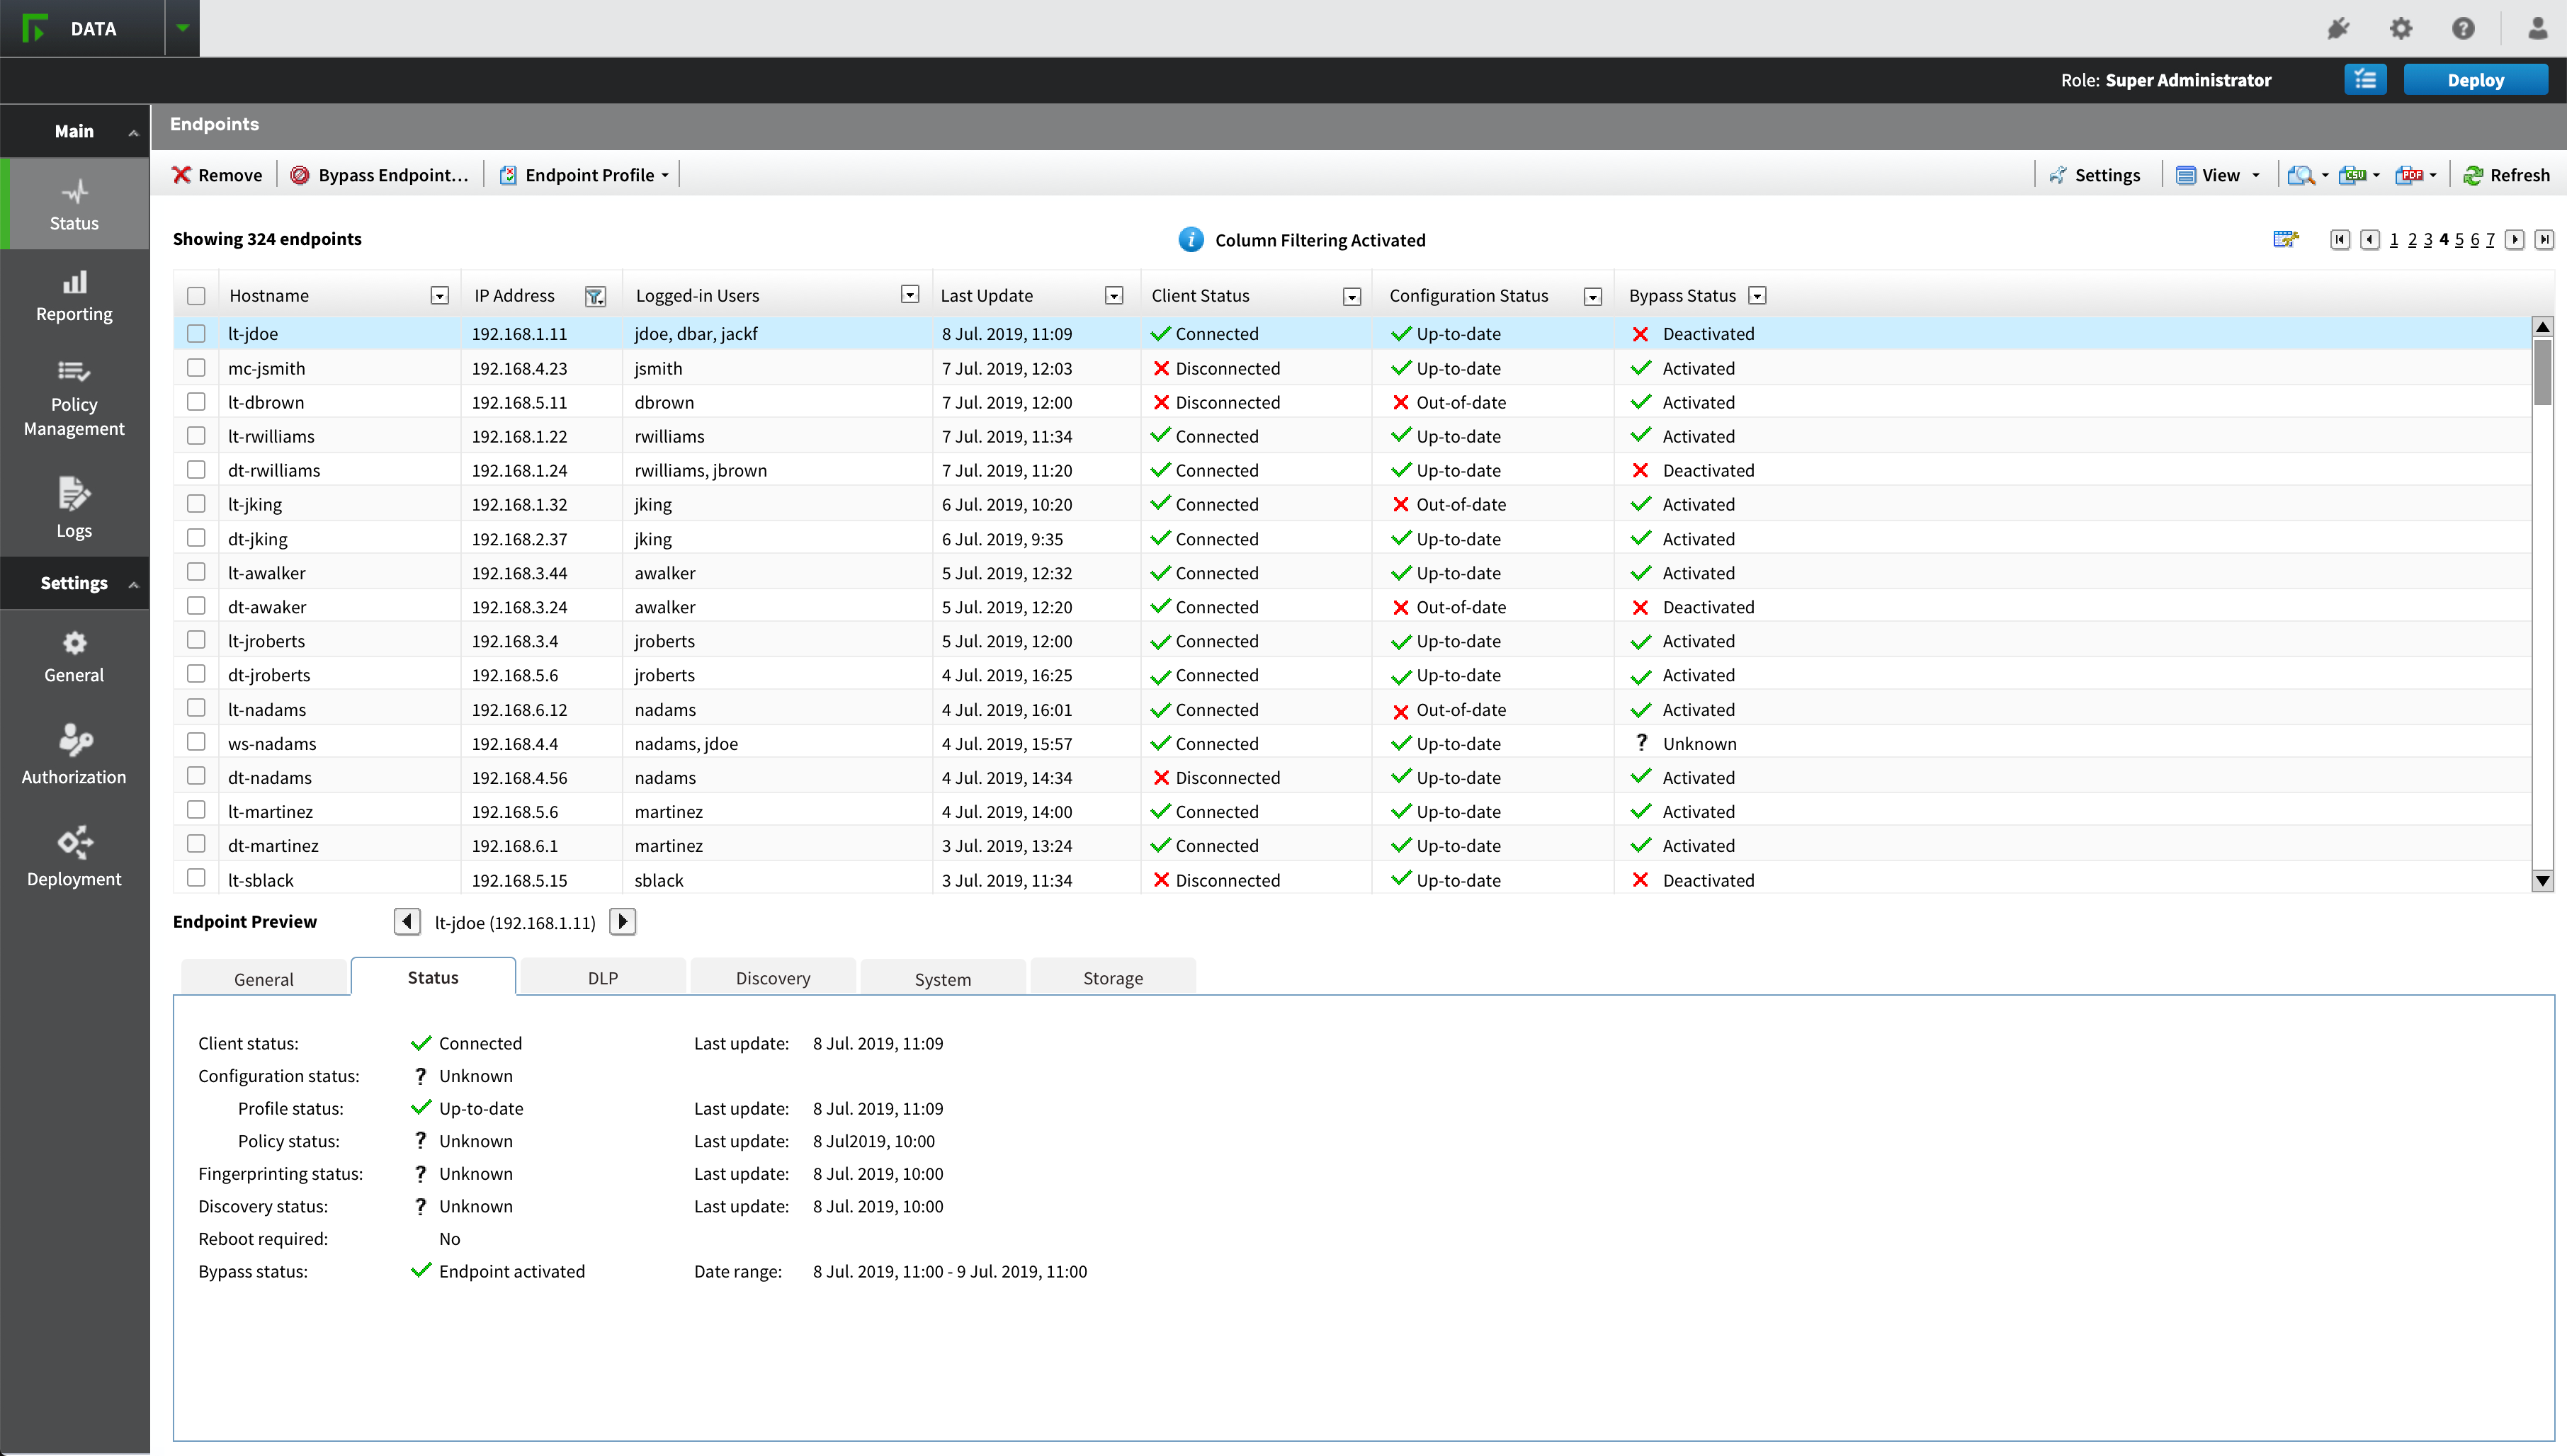
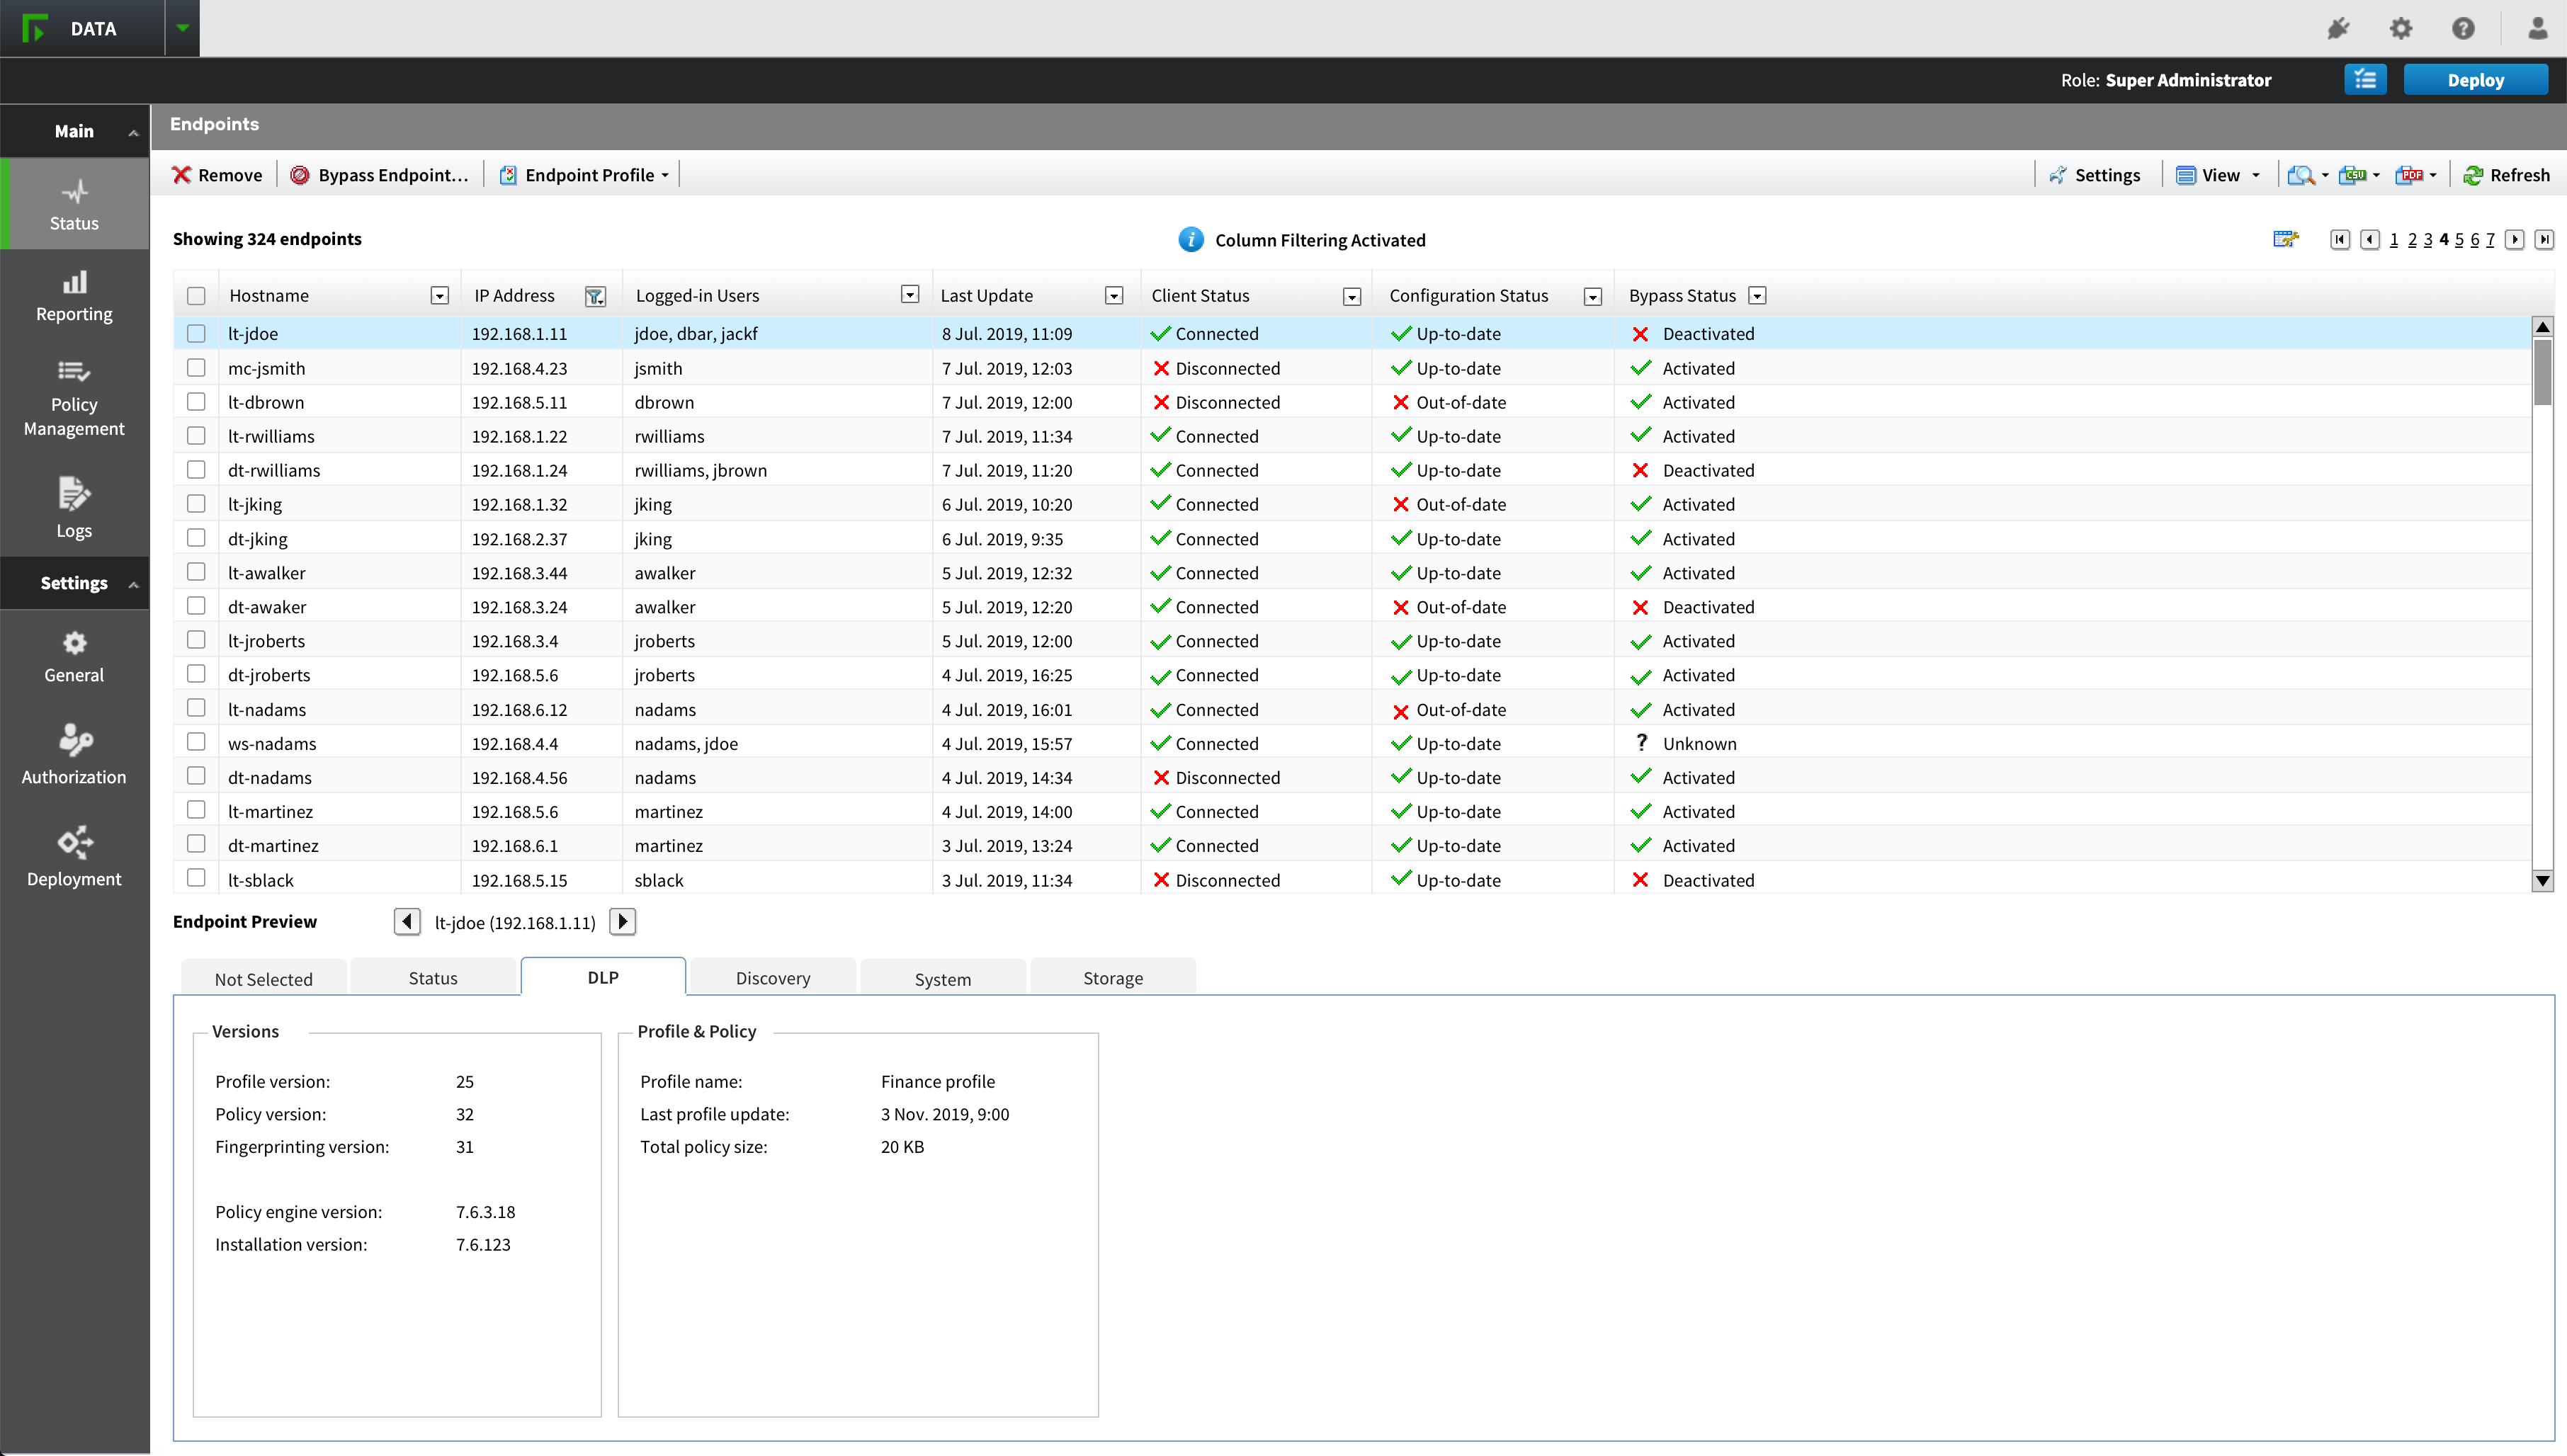
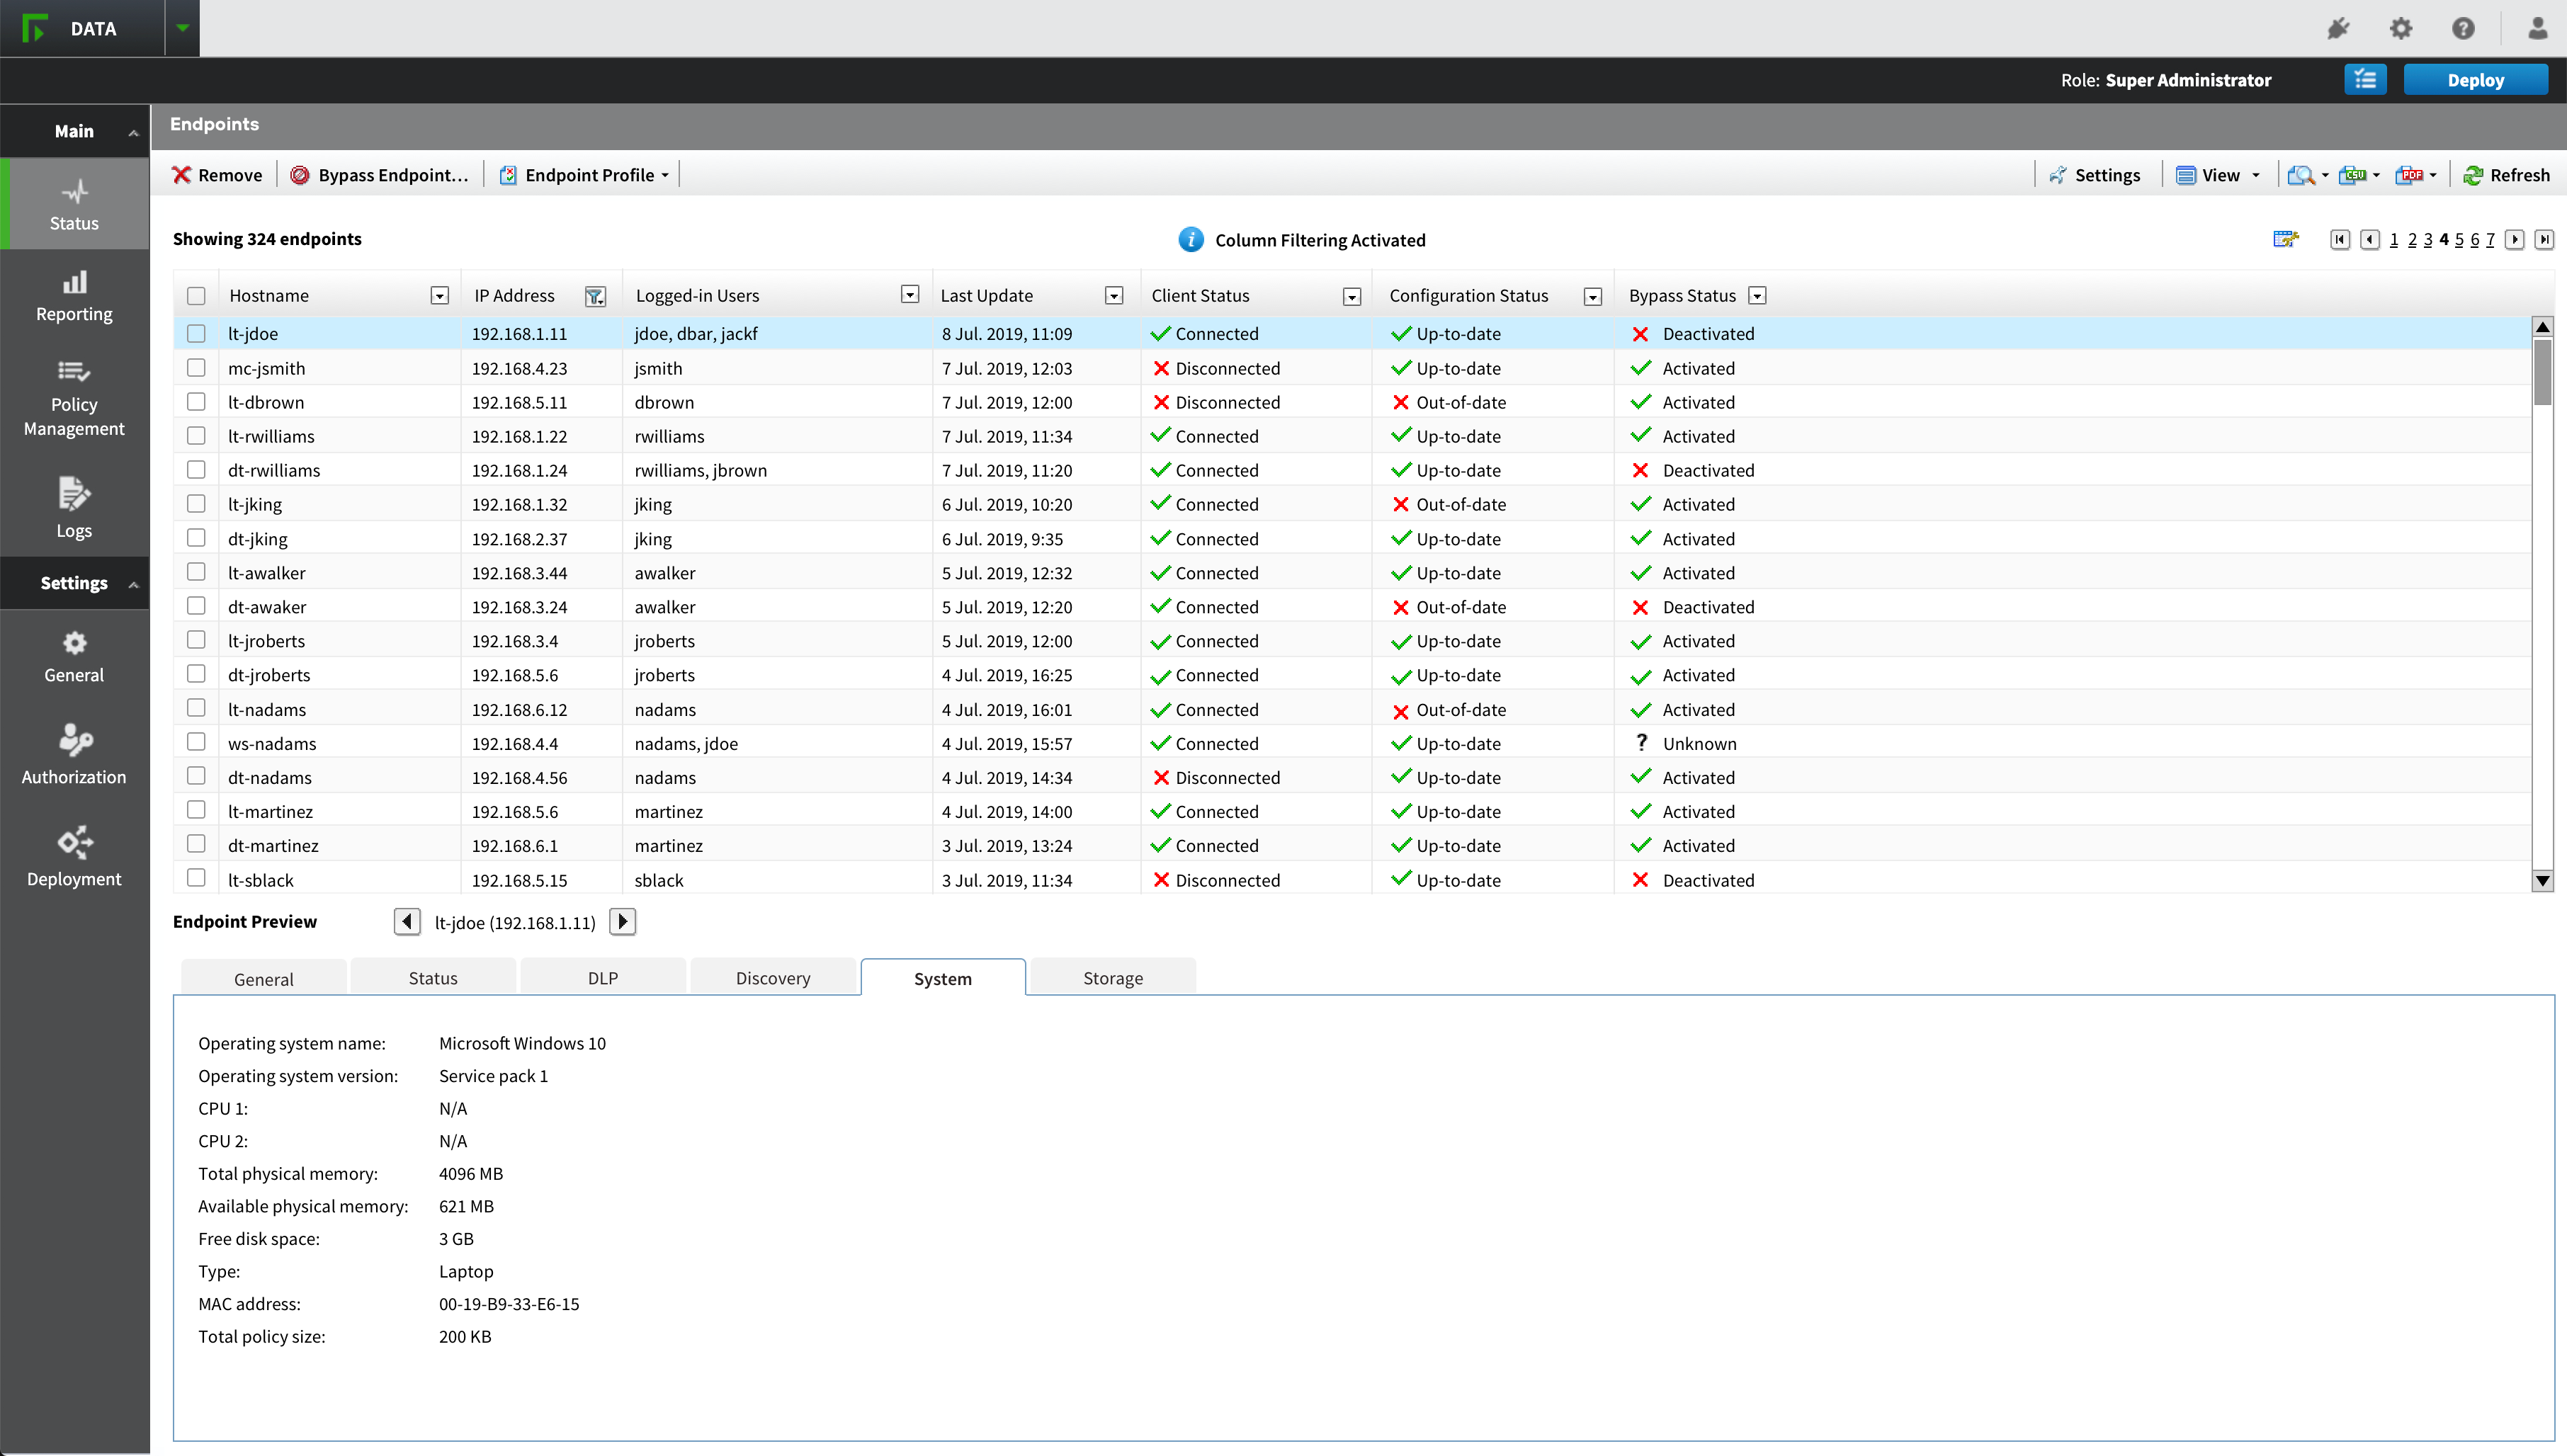
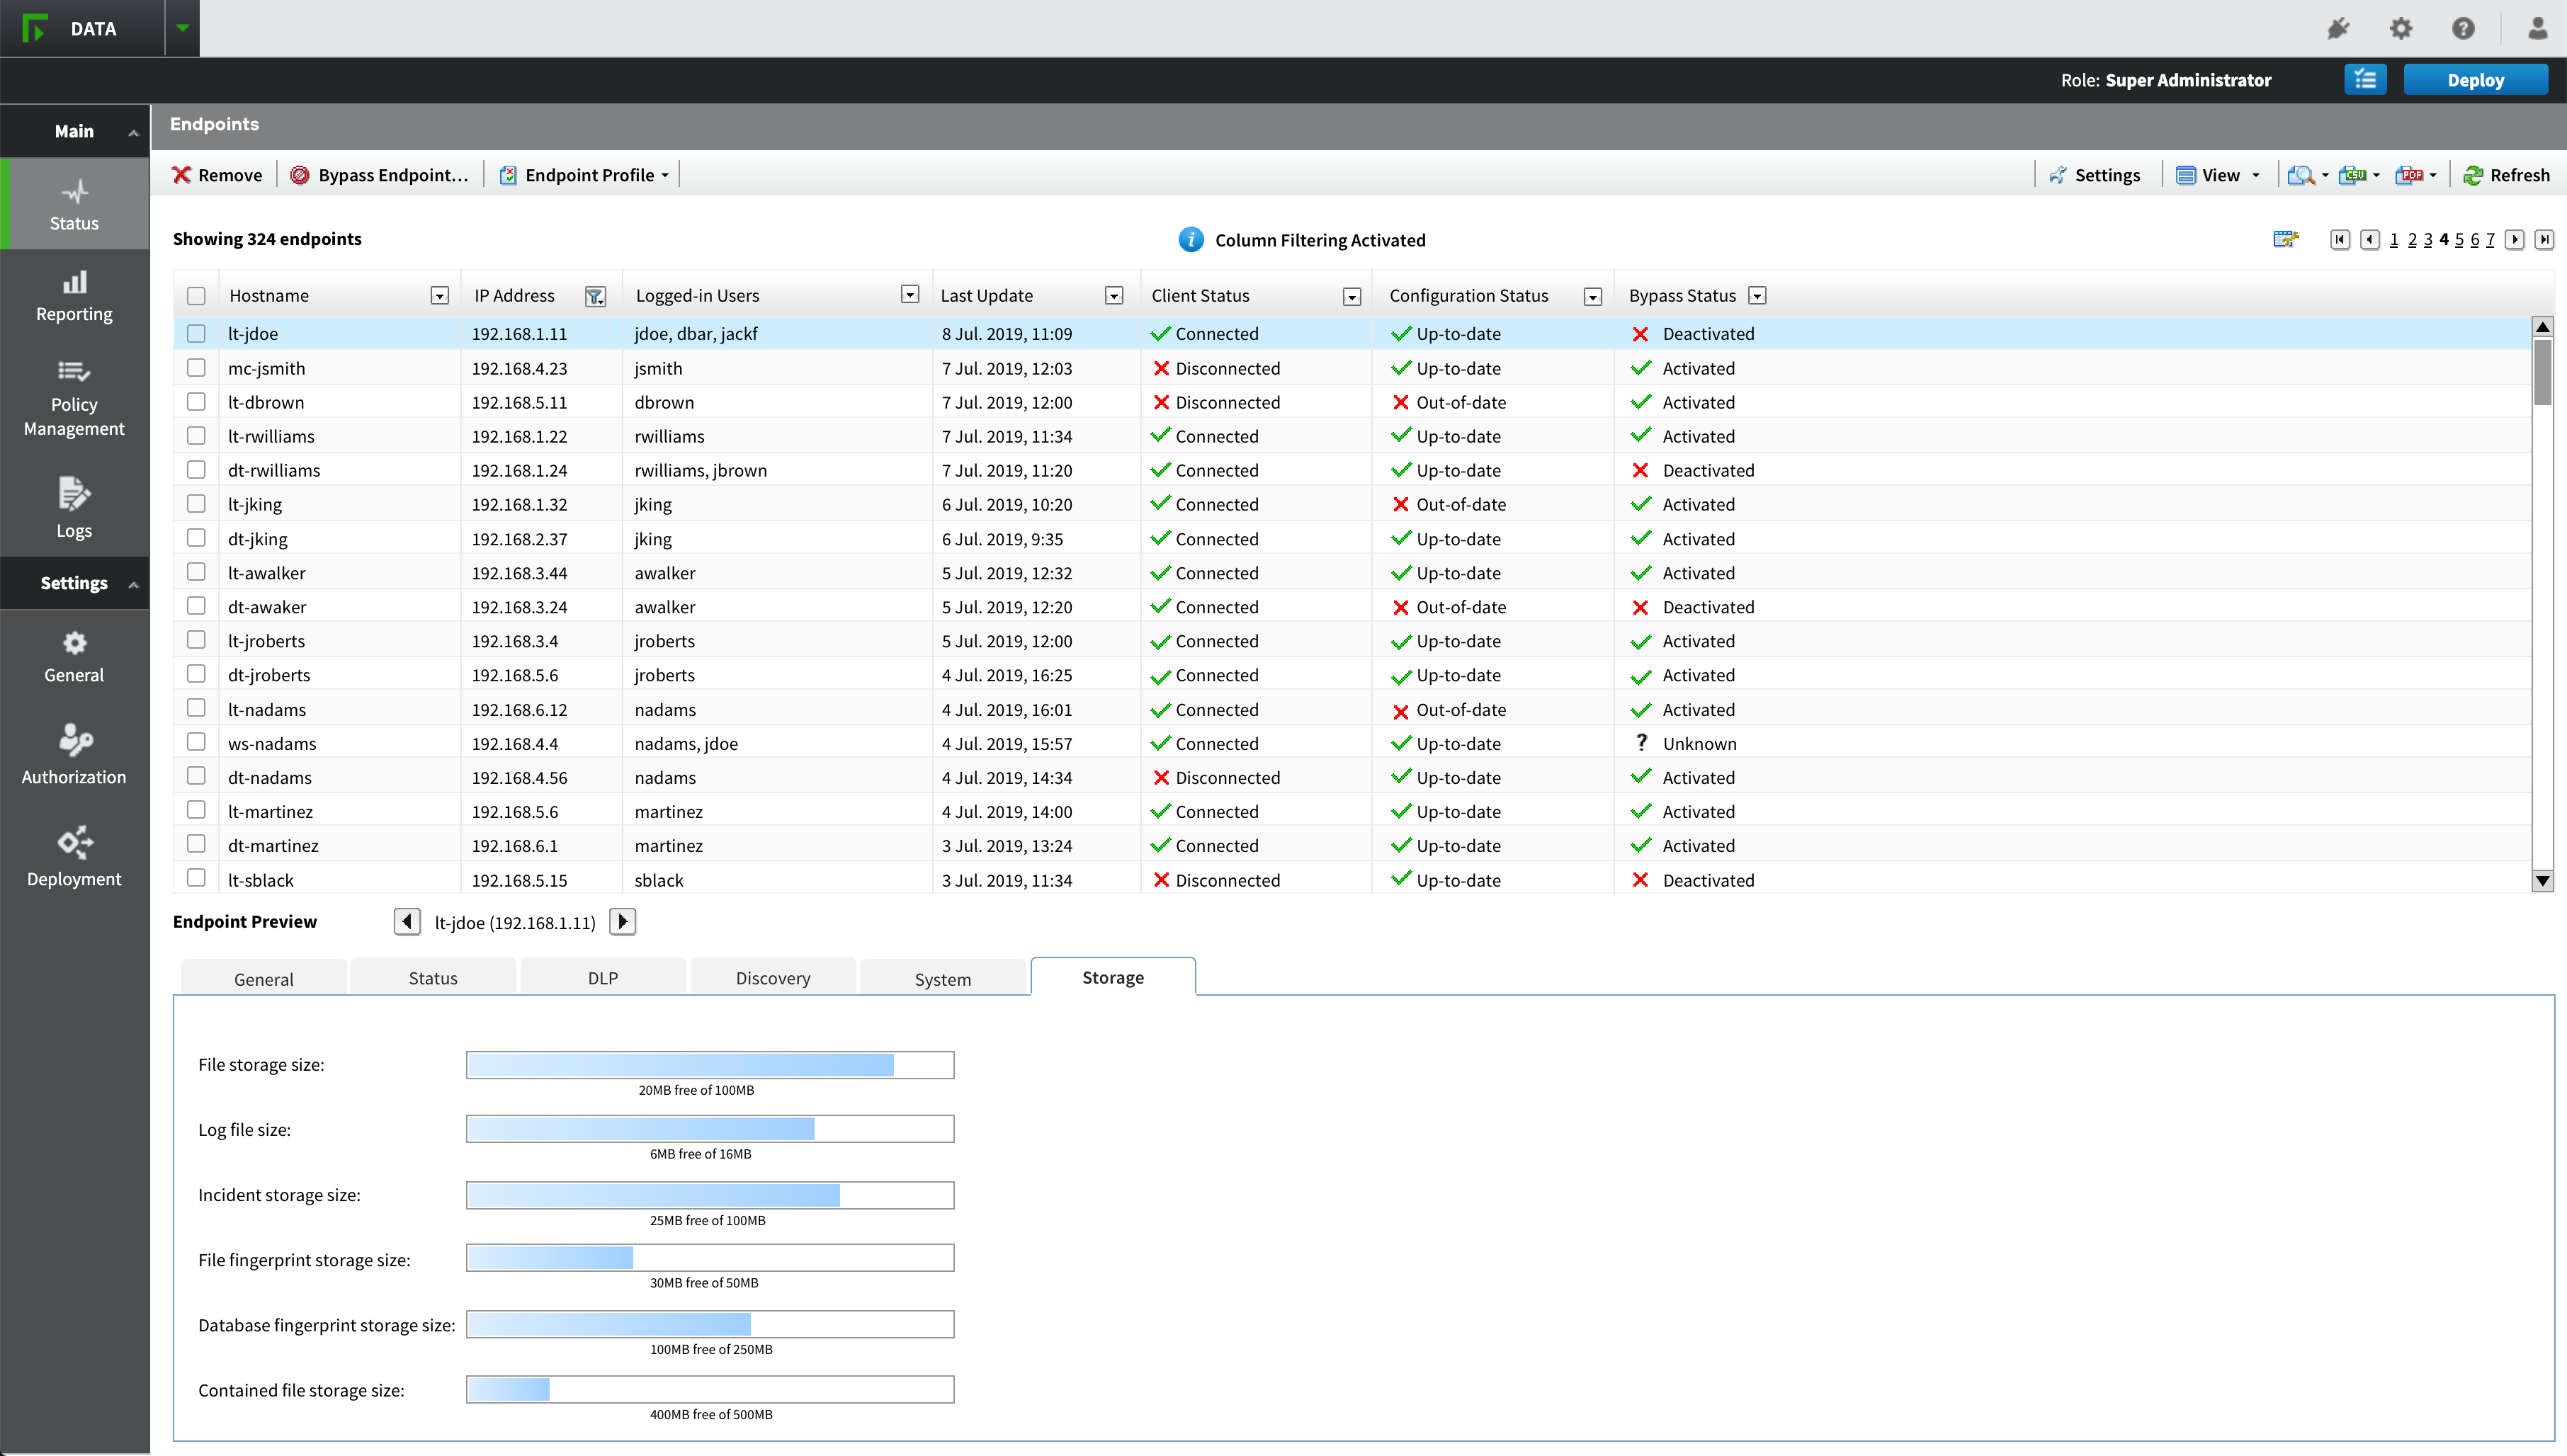
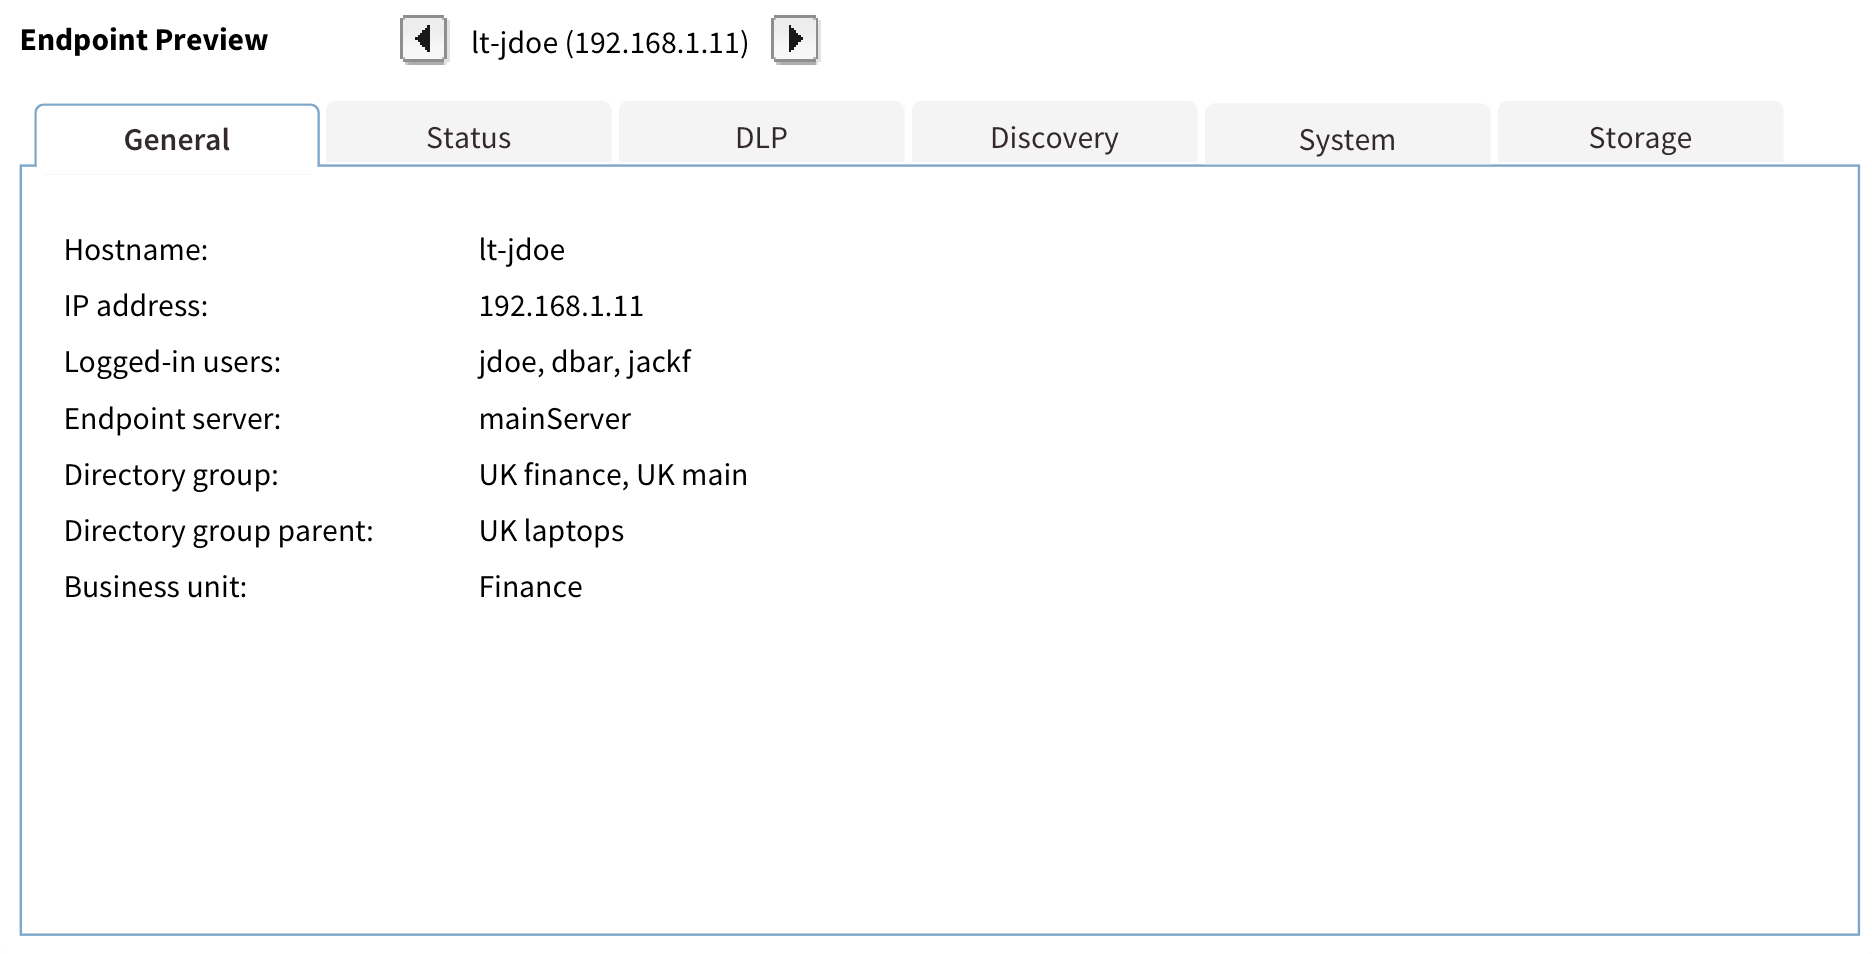
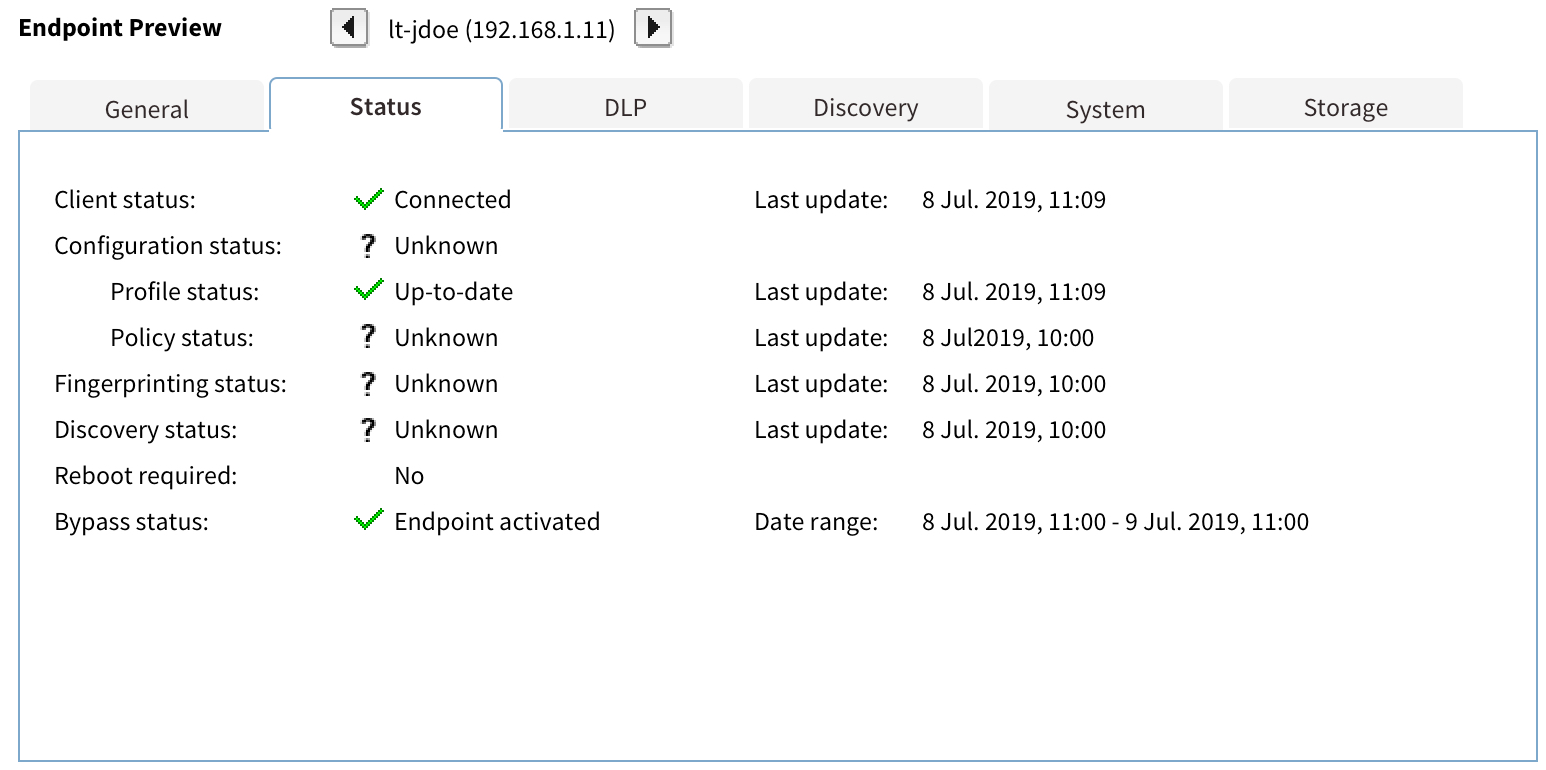
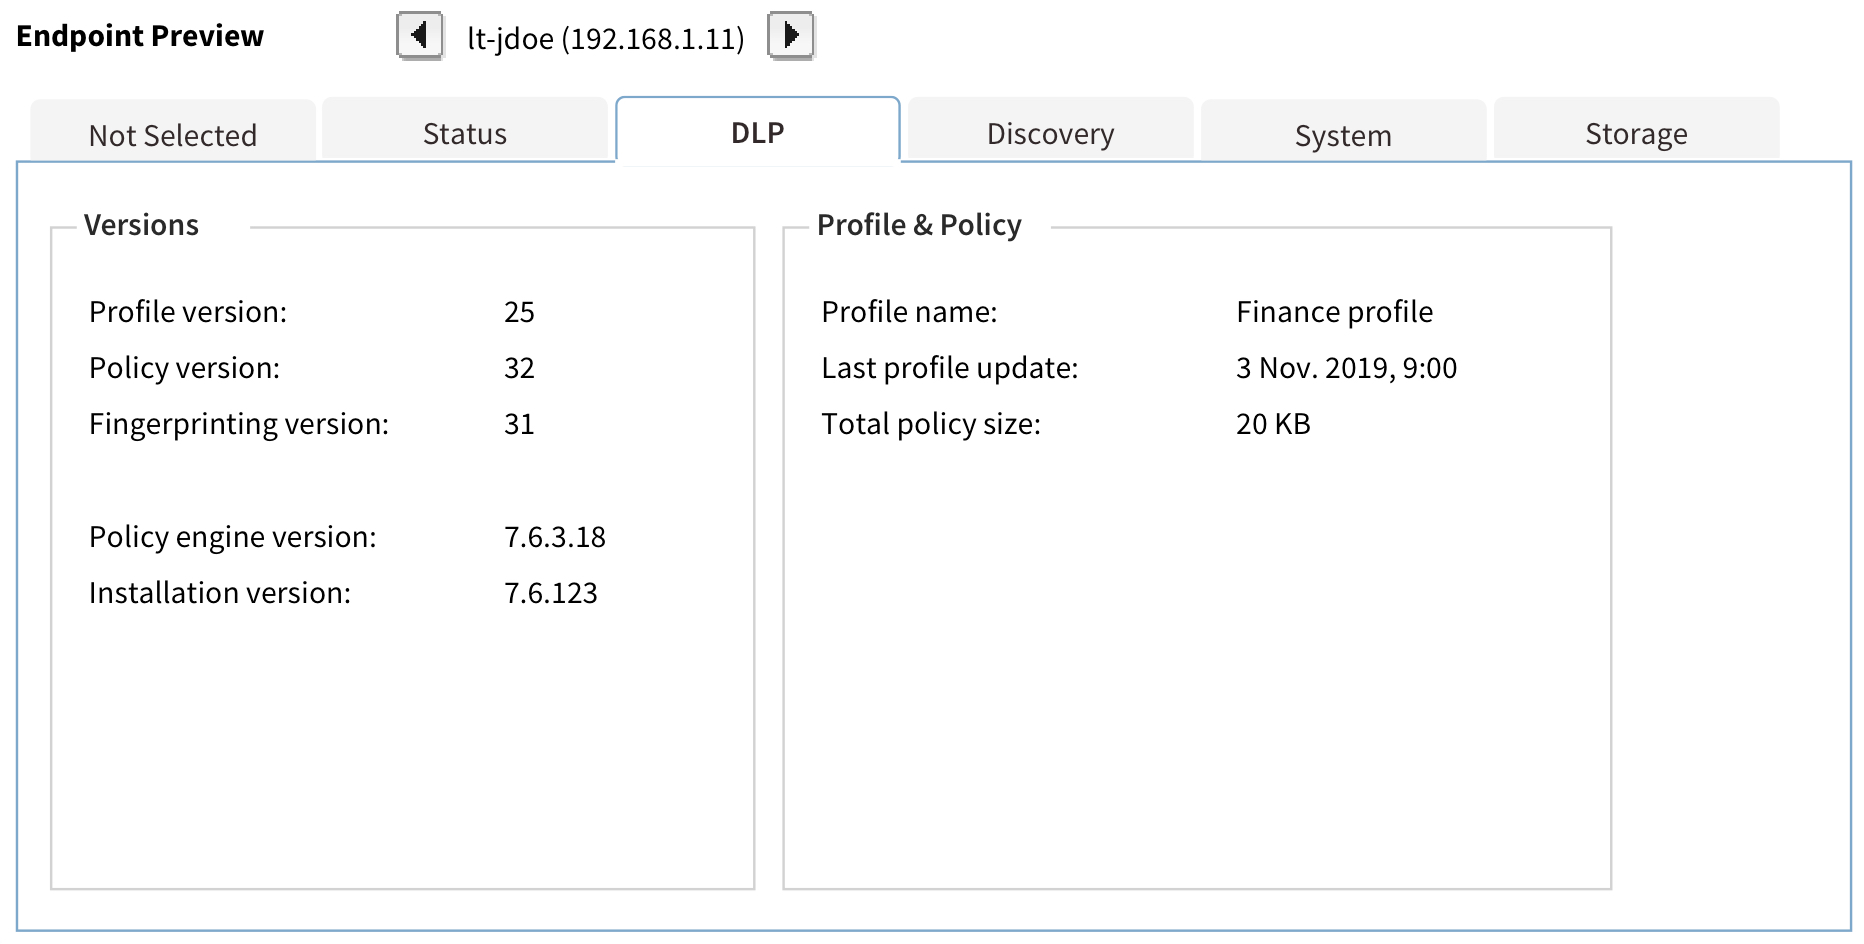
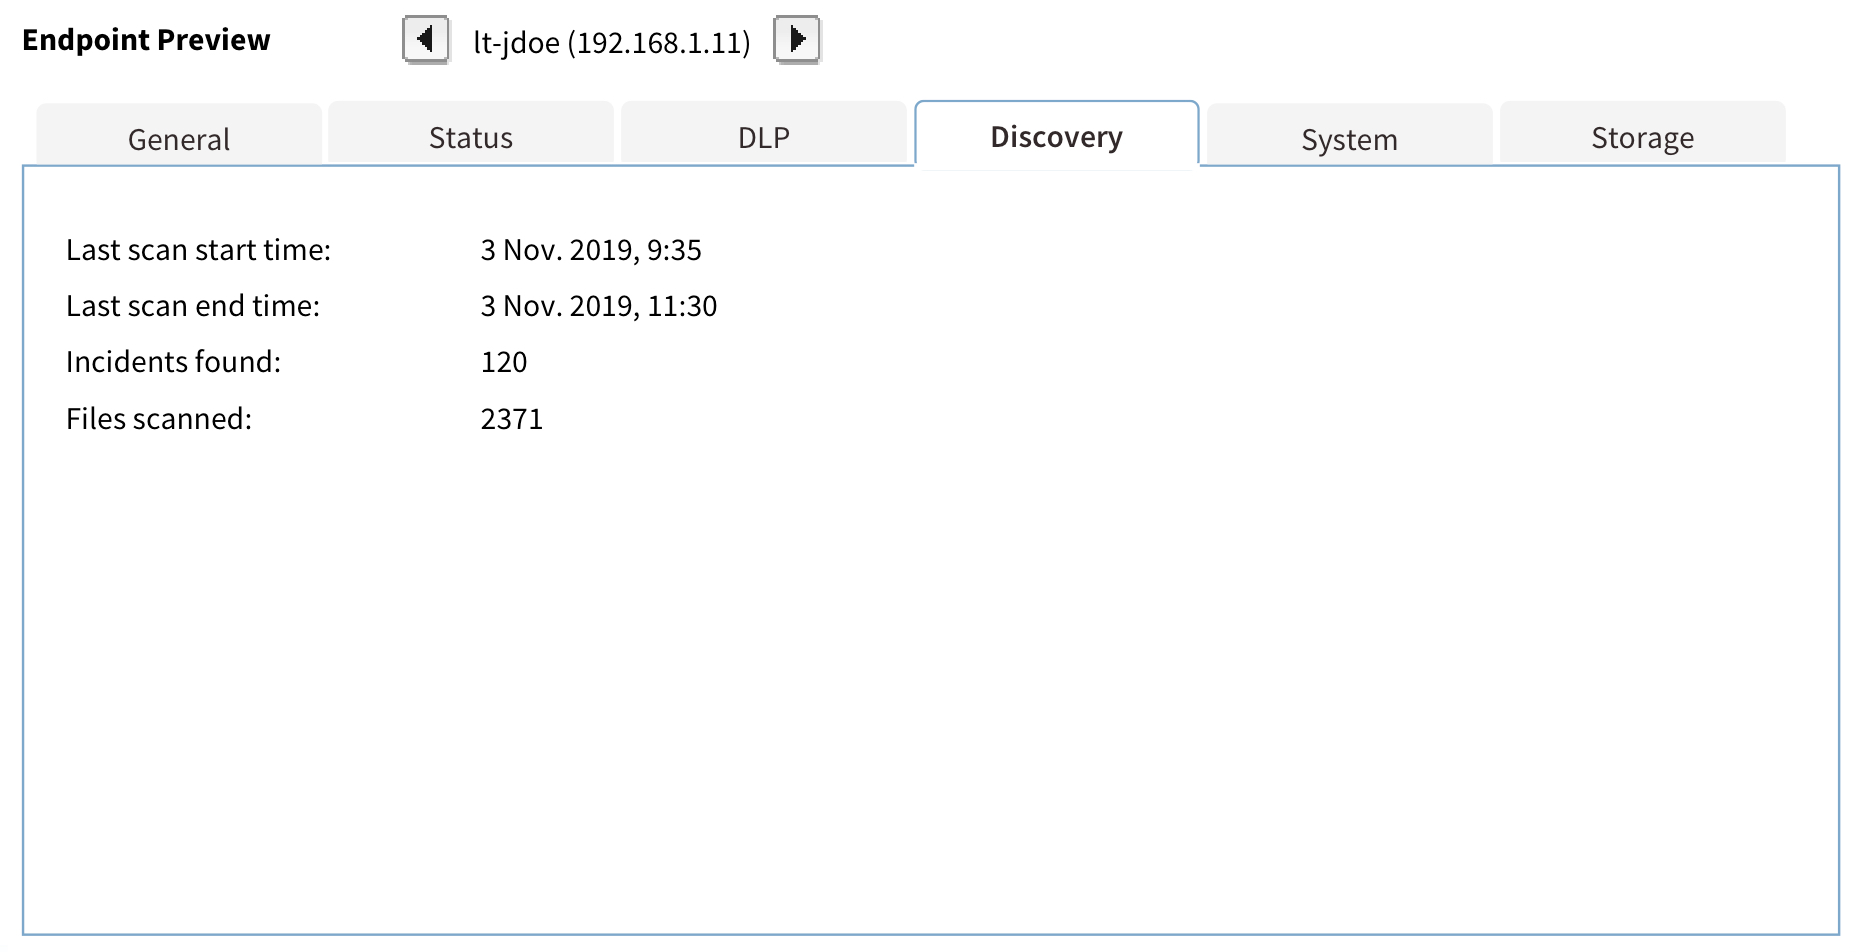
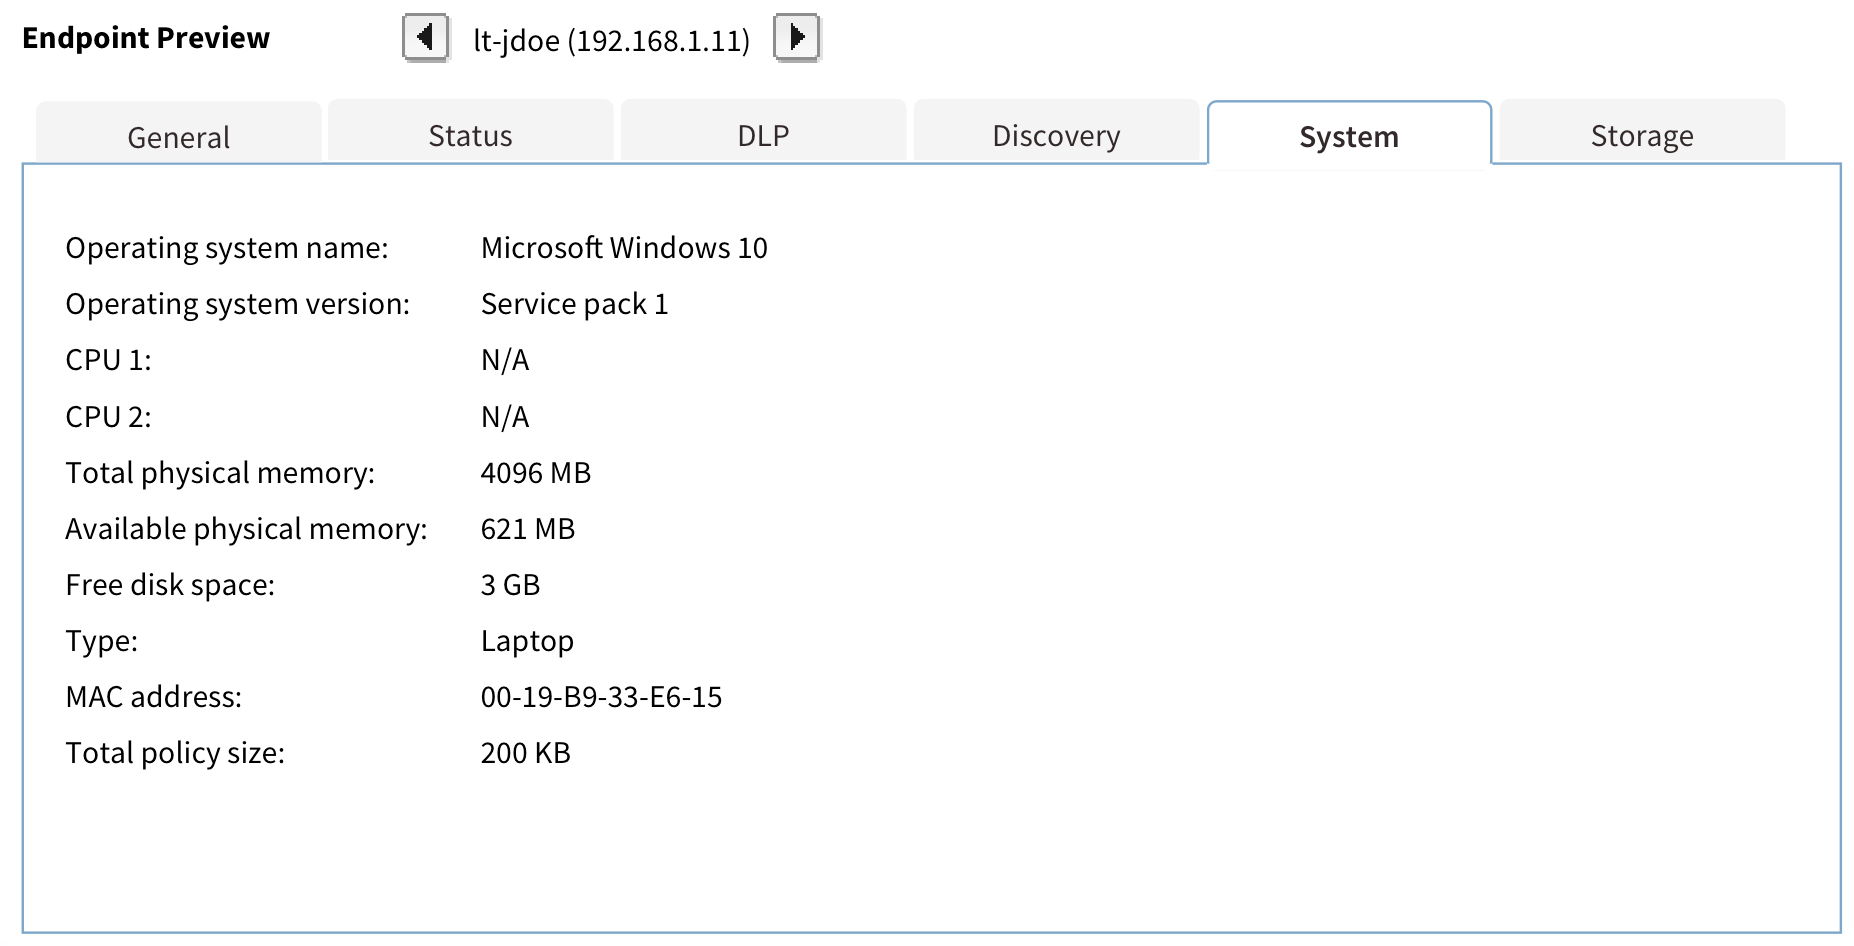
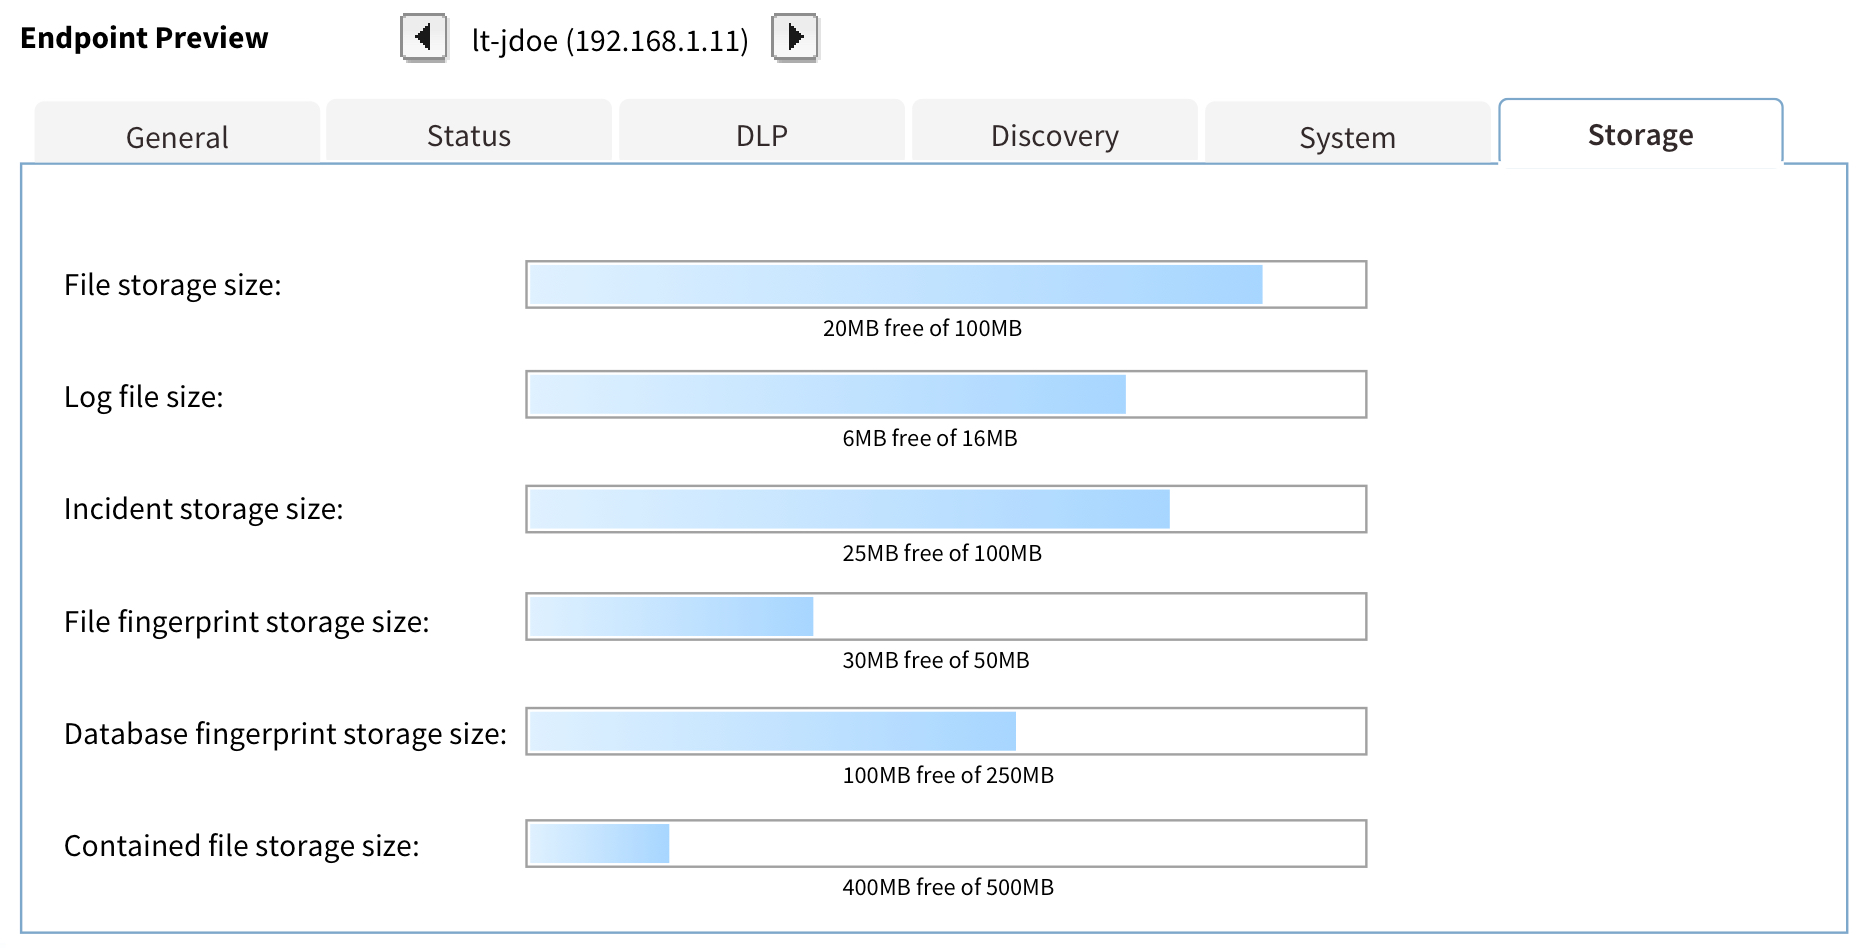
Detailed information about each endpoint is shown in a tabbed interface at the bottom of the screen. Each tab focuses on different aspects such as General, Status, DLP, Discovery, System, and Storage.
The tabbed layout helps in organizing detailed data into manageable sections. This ensures that users can quickly find the information they need without scrolling through long pages of data. The use of tabs also keeps the interface clean and organized. - Export and Batch Operations:
Challenge: Facilitating the export of data and performing batch operations on multiple endpoints without disrupting the workflow.
Solution: Provided straightforward options to export data to PDF or CSV formats directly from the interface. Included batch operation capabilities with clear instructions and confirmations to prevent accidental changes.
Easy access to export and batch operation features ensures that users can perform these tasks efficiently without navigating away from the main interface. This design decision supports workflow continuity and productivity. - Consistency and Familiarity:
Challenge: Maintaining a consistent look and feel across different parts of the application to reduce the learning curve.
Solution: Used design patterns and UI elements throughout the interface. Ensured that interactive elements behave predictably and provide feedback to user actions.
The overall design language is consistent across different screens, with a uniform color scheme, typography, and iconography. Interactive elements like buttons and tabs behave predictably.
Maintaining a consistent look and feel reduces the learning curve for users and ensures a cohesive experience across different parts of the application. Familiar UI patterns increase user confidence and satisfaction. - Performance and Responsiveness:
Challenge: Ensuring the interface remains responsive and performs well even with large datasets.
Solution: Optimized the interface for performance by using efficient data loading techniques, such as lazy loading and pagination. Ensured the UI is responsive to different screen sizes and devices.
The design incorporates pagination to manage large datasets efficiently and to help in loading data in chunks, which improves performance and responsiveness. The UI elements are designed to be responsive to different screen sizes. This ensures that the application can be used effectively on different devices, enhancing accessibility and user experience.
By addressing these challenges with thoughtful UX design solutions, the endpoint status screen can become a powerful tool for administrators, enabling them to efficiently manage and secure their network of endpoints.
Click the gallery to see more screenshots.

